
. INTRODUCTION
The paleohydrological variation history inferred from water-level fluctuations of closed lakes has been extensively studied for deciphering the past moisture changes over the Tibetan Plateau and its northern foreland areas (e.g., Long et al., 2012; Chen et al., 2013; Rades et al., 2015; Long and Shen, 2015), which have been affected by the Asian summer monsoon and the westerlies (An et al., 2012). The exposed beach features and lacustrine sediment remains around closed lake basins can provide direct evidence for the past lake-level changes. A robust geochronological constraint is vital for interpreting and correlating the paleoenvironmental events derived from such fragmentary terrestrial sequences. Age control often relies upon radiocarbon dating of organic matter, which might encounter the following problems: (1) scarcity of dating material as low total organic carbon contents of lake sediments in the arid and semi-arid areas (Long et al., 2011), and (2) the vulnerability to contamination by older reworked carbon from the catchment or younger carbon from plant roots or as result of bioturbation (Mischke et al., 2016); additionally, the accuracy of 14C dating could also be biased when using carbonate such as shells because of lake reservoir effect which is likely to vary spatially and temporally (Hou et al., 2012).
Compared with radiocarbon dating technique, optically stimulated luminescence (OSL) can be more practical in dating lake-level related sediments especially from the arid areas owing to widely available dating materials (quartz and feldspar) and a wider age range. Moreover, a luminescence age is entirely independent of variations in lake reservoir effects. However, one common concern about the accuracy of OSL dates may have been associated with the resetting degree of luminescence signals before the deposition, especially for the lacustrine environment. The sediment transport under the water with subdued daylight conditions could potentially result in partial bleaching and hence age overestimation. The degree of bleaching before a deposition can theoretically be evaluated by checking the distribution of equivalent doses (Des) and the corresponding statistical analysis based on numbers of small-aliquots or even single-grains (e.g., Wallinga, 2002). As the coarse grained quartz signal of young (e.g., Holocene) beach sediments from arid northern China is relatively dim, large aliquots are normally preferred for the De determination. However, the averaging effects of great numbers of grains on each aliquots could have masked the real bleaching degree (Roberts et al., 2018). Alternatively, comparing ages derived from luminescence signals with different bleaching rates has been used to identify well-bleached quartz (Murray et al., 2012; Reimann et al., 2015; Long et al., 2019). On the other hand, for dose rate calculation the estimation of the past water content for the water-lain sediments is very critical; for a given sample there is typically a ∼1% change in age for every 1% change in water content (Roberts et al., 2018). Water content may have changed through time due to desiccation or wetting of the lake as well as sediment compaction, and thus the water content value determined in situ may not be able to represent that for the burial time of sediments.
In this study, a major beach ridge from Jinchang paleolake over the northeast (NE) Tibetan Plateau foreland was investigated to reveal the timing of the lake high-stand in this area. Both luminescence and radiocarbon dating methods were applied to an outcrop from this beach ridge. To ensure the robustness of the chronological framework, (1) we compared the luminescence ages derived from quartz OSL and K-feldspar signals to test the bleaching degree, and (2) the suitability of an assumed water content value was confirmed by cross-checking of the calculated luminescence age with independent radiocarbon age derived from terrestrial charcoal material. Finally, the timing of the highest wave-built beach ridge in Jinchang paleolake was compared with the lake-level history from adjacent areas, and then its paleo-climatic implication was discussed.
. REGIONAL SETTING AND CHRONOLOGICAL SAMPLES
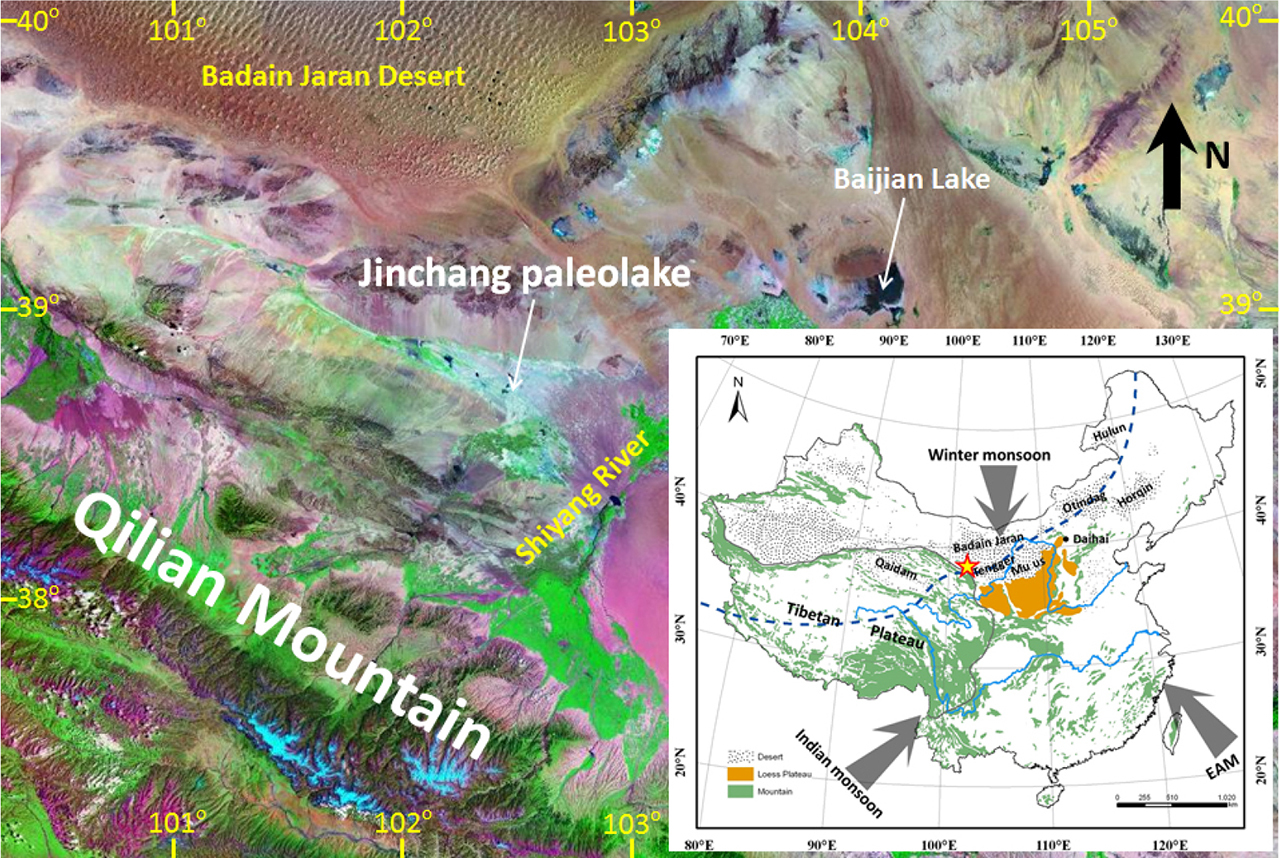
Jinchang paleolake (N38°50′, E102°20′, ∼1340 m above modern sea level) is situated over the NE Tibetan Plateau foreland (inset of Fig. 1). The modern climate in this region is dominated by the Asian summer monsoon from July to September, which brings most of the rainfall for the whole year. The cold, dry air masses (i.e., winter monsoon) associated with the Siberian–Mongolian high-pressure system generally prevail during the winter (Fig. 1). Nowadays, the lake is dried out; only patchy vegetation, mainly consisting of grass and shrubs, is distributed in places where the groundwater level is close to the ground surface. Geomorphological survey around Jinchang paleolake has demonstrated a series of paleoshoreline features to the east of the lake basin.
Fig. 1
Map showing the location of Jinchang paleolake (star) and other sites (Baijian Lake, Tegger Desert, Mu us Desert, Otindag Desert and Horqin Desert) mentioned in this study. EAM denotes East Asian monsoon, and its northern limit is shown by the blue dashed line (inset).
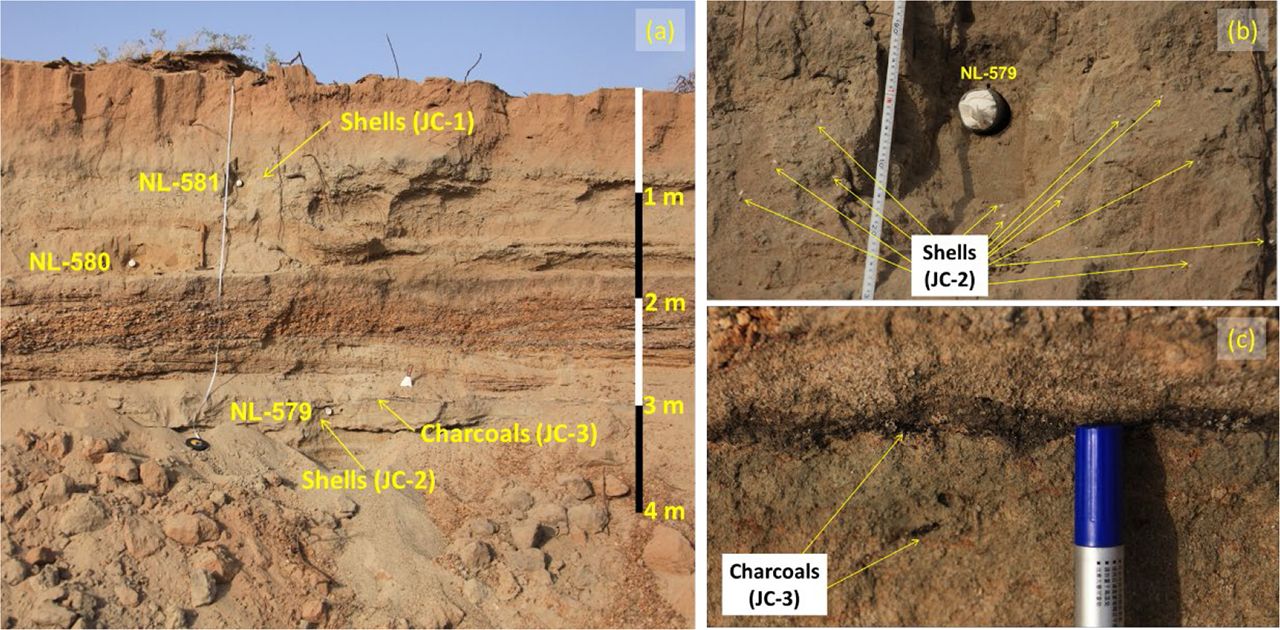
We sampled an outcrop named JC section from the highest beach shoreline ridge for dating. The section is about 4 m thick, and can be roughly divided into four sedimentary units from bottom to top (Fig. 2a): the basal unit (4.0–2.9 m, U1) consists of light-coloured stratified gravelly sands with small numbers of shells and a charcoal layer intercalated at a depth of 3.1 m; the overlying unit (2.9–1.9 m, U2) is pebbly gravels dominant with cross-bedded structures; this unit is covered by a layer of greyish silty sands (1.9–0.8 m, U3) with rich shells at around 1.0 m; the uppermost unit mainly consists of brownish sandy silts (0.9–0 m, U4). Three samples (NL-579, 580, and 581) were collected for luminescence dating by hammering steel tubes (5-cm diameter and 20-cm long) into the freshly cleaned profile at the depths of 3.2 m, 1.7 m, and 1.0 m (Fig. 2a). Two shell samples JC-1 and JC-2 (Fig. 2b) for 14C dating were obtained from locations where the two luminescence samples (NL-579 and NL-581) were taken from; another 14C sample was collected from the charcoal layer at a depth of ∼3.1 m (JC-3, Fig. 2c), just overlying the location of luminescence sample NL-579.
. DATING EXPERIMENTS
The sediments were first wet sieved to obtain the coarse grain fraction of 100–200 μm and then treated with 10% HCl and 30% H2O2 to remove carbonates and organic matter, respectively. Quartz (2.62–2.70 g/cm3) and K-feldspar (<2.58 g/cm3) fractions were separated using heavy liquid (sodium polytungstate). The quartz grains were etched with 40% HF for 60 min (followed by an HCl rinse) to remove the outer alpha-irradiated layer of the quartz grains and also eliminate potential feldspar contamination. We did not etch the K-feldspar grains with HF; instead, the external alpha-irradiated dose rate of K-feldspar grains was taken into account for the total dose rate calculation.
The De measurements were carried out in the NIGLAS Luminescence Dating Laboratory with an automated Risø TL/OSL DA-20 luminescence reader equipped with a 90Sr/90Y beta source and a classic stimulation and detection head consisting of blue (∼470 nm) and infrared (∼870 nm) light-emitting diodes. Quartz OSL was detected through a 7.5-mm-thick Hoya U-340 filter, and infrared stimulated luminescence (IRSL) from K-feldspar was detected through a combination of Schott BG39 and BG3 filters. Due to relatively weak signal intensity, large aliquots (6 mm) were mounted on stainless steel discs using silicone oil for quartz OSL measurement, and the conventional single aliquot regenerative (SAR) protocol was used to determine De (Murray and Wintle, 2000). The purity of quartz fraction was checked by the IR depletion ratio (Duller, 2003), and also by examining the 110°C TL peak (Li et al., 2002) in the SAR sequence for each aliquot. Preheat plateau tests were carried out on each of three samples to select the proper measurement condition. Preheat temperatures varied between 160°C and 280°C at 20°C intervals (3 aliquots for each temperature), while the cut-heat temperature tracks the preheat temperature by −20°C. OSL signals of the first 0.48 s integral after early background subtraction (from 0.48 to 4.8 s) were used for growth curve construction. Twenty aliquots were measured for quartz De estimation. K-feldspar fraction was prepared with the aliquot size of ∼2 mm diameter, and then measured separately using the two post-IR IRSL (pIRIR) protocols. Following the first stimulation temperature at 50°C (IR50), the subsequent IR stimulation is recorded at 150°C (pIRIR150, Madsen et al., 2011; Reimann and Tsukamoto, 2012) or 225°C (pIRIR225, Thomsen et al., 2008) to obtain pIRIR signals. The preheat temperatures are 180°C and 220°C for protocols pIRIR150 and pIRIR225, respectively. For both pIRIR protocols, the test dose was set to ∼5 Gy, and the integrated signal was calculated from the first 10 s minus a background from the last 10 s. Eight discs for each pIRIR protocol were measured for determining the K-feldspar Des.
The concentrations of uranium (U), thorium (Th), and potassium (K) were determined by neutron activation analysis (NAA). Materials were collected in the surrounding of the OSL sampling tube within a radius of ∼30 cm, rather than only relying on material from the tube for dose rate measurement. The material was then ground, and ∼5 g of the homogenized material was used for NAA analysis. The conversion factors of Guérin et al. (2011) and the β-attenuation factors after Mejdahl (1979) were used to calculate the external β- and γ-dose rates. The water content of 10% (±5%) was assumed to correct the β- and γ-dose rates for the water attenuation. For the internal dose rate calculation of K-feldspar, a K concentration of 12.5 ± 0.5% and rubidium (Rb) content of 400 ppm (Huntley and Hancock, 2001) were assumed. The cosmic ray dose rate was estimated for each sample as a function of depth, altitude, and geomagnetic latitude, according to Prescott and Hutton (1994).
14C dating was carried out with accelerator mass spectrometry (AMS) at Rafter Radiocarbon Laboratory (New Zealand). The shell and charcoal samples were cleaned and pretreated with the acid-alkali-acid procedure, prior to combustion, graphitization and 14C measurement. The 14C ages were corrected for fractionation by d13C values measured simultaneously and then calibrated to obtain the calendar age (cal a BP) with IntCal13 curve (Reimer et al., 2013).
. RESULTS AND DISCUSSION
Quartz OSL ages
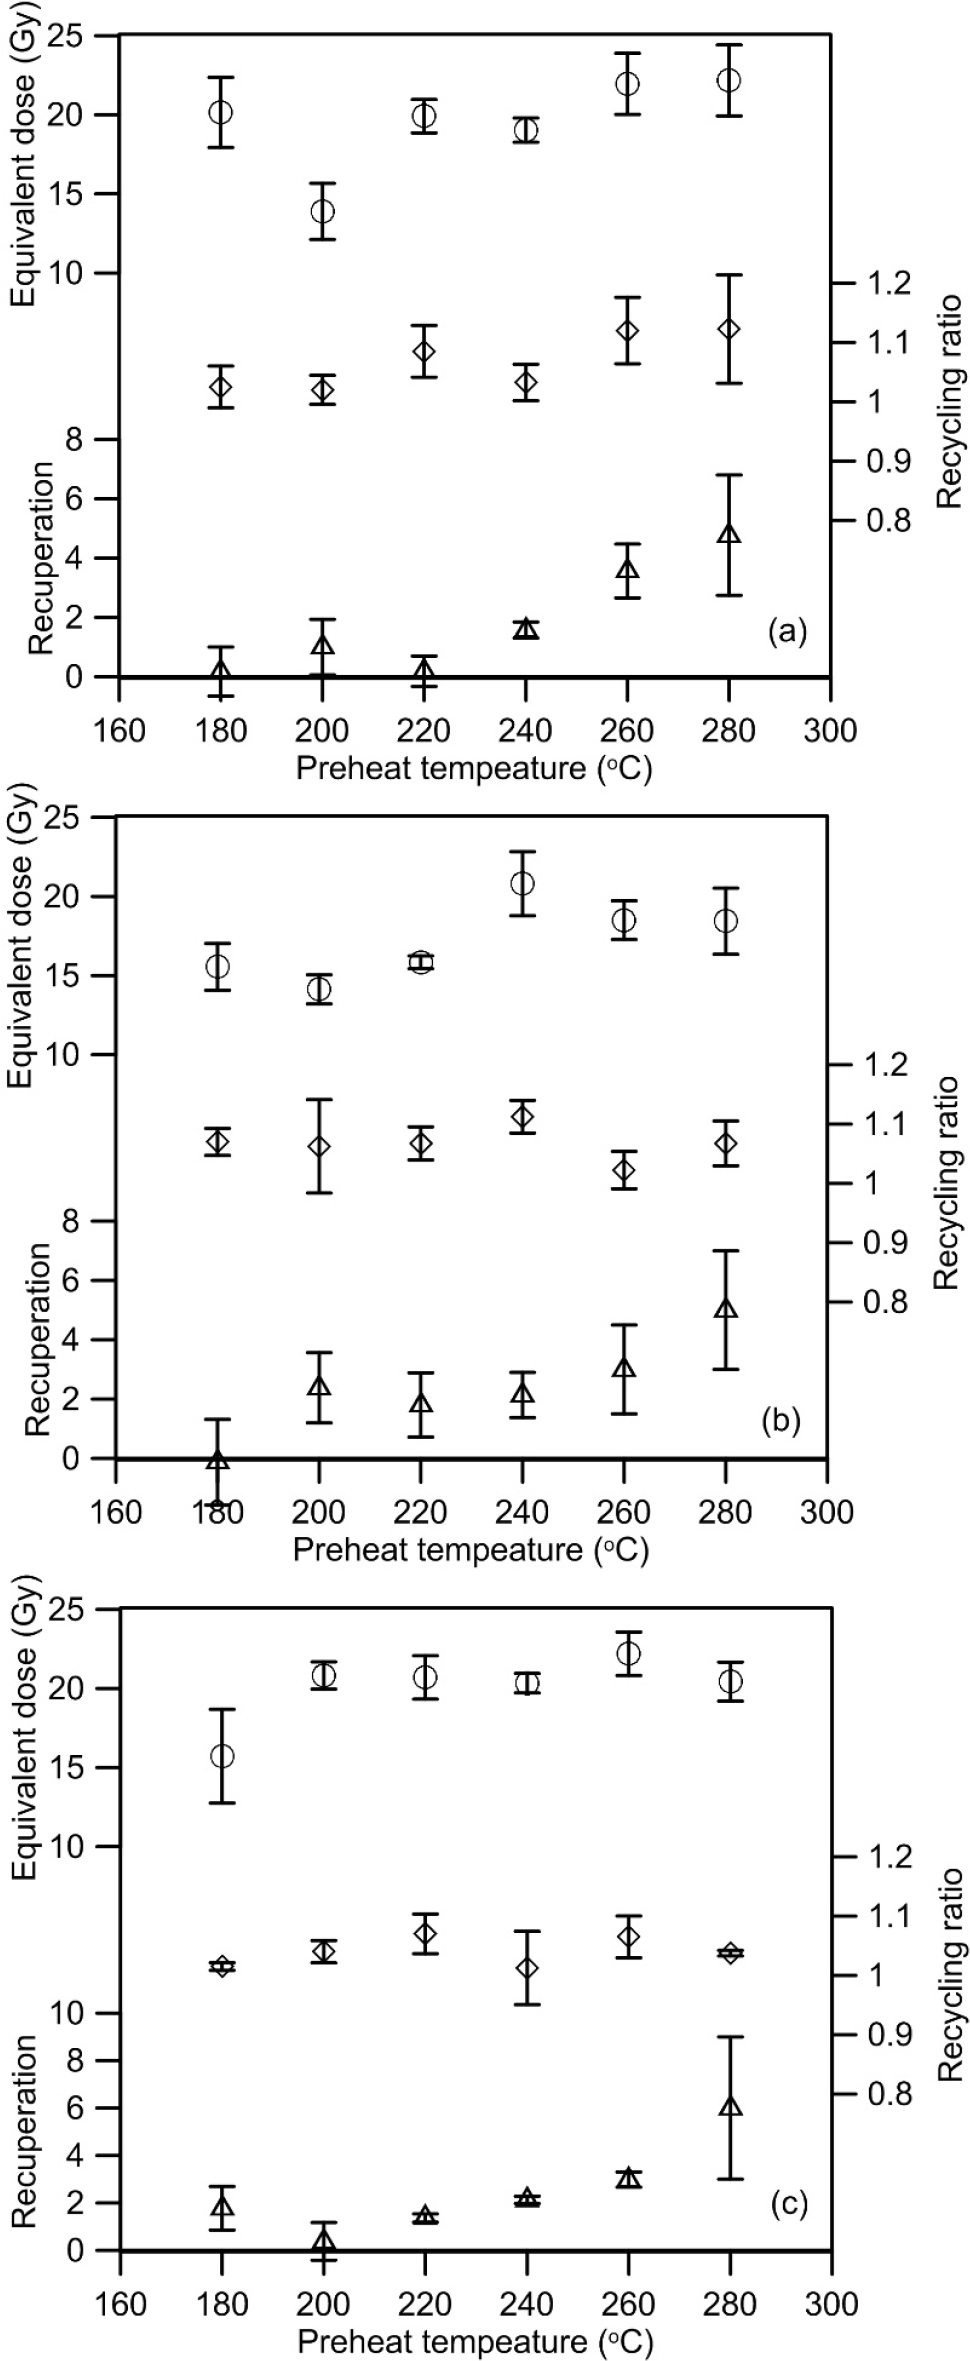
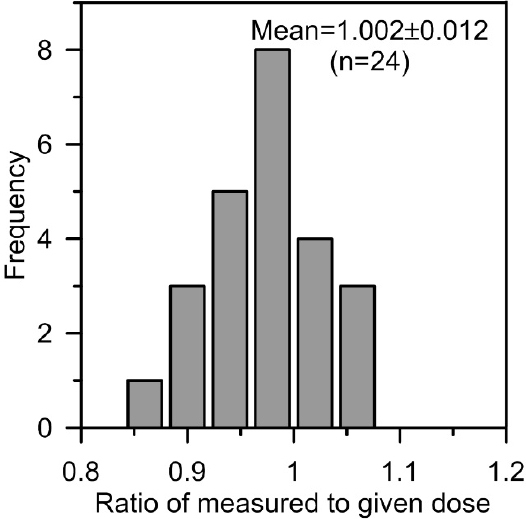
Preheat plateau tests were used to assess the performance of the SAR protocol and then choose suitable thermal treatments for De measurement. As shown in Fig. 3, the results suggested that recycling ratios were generally between 0.9 and 1.1, and recuperation (%) values were generally less than 5% for all preheat temperatures; a De plateau was observed between preheat temperature of 220 to 280°C. Therefore, a preheat temperature at 260°C with a cut-heat at 240°C was applied for the De determination. The validity of the chosen preheat temperature was further confirmed by dose recovery tests at this fixed combination of preheat and cut-heat temperatures. Twenty-four discs (eight aliquots for each sample) were given to a known beta dose of ∼20 Gy after twice bleaching at room temperature for 100 s with blue LEDs, with a pause of 5000 s in between; and then the routine SAR protocol with preheating of 260°C and cut-heat of 240°C was used to recover the known dose. Fig. 4 presents the summary of dose recovery tests, showing most of the dose recovery ratios are within 10% of unity. The mean dose-recovery ratio of 1.002 ± 0.012 (24 aliquots in total) indicates that the applied SAR protocol can accurately recover a known dose given to a sample before heating and optical treatment.
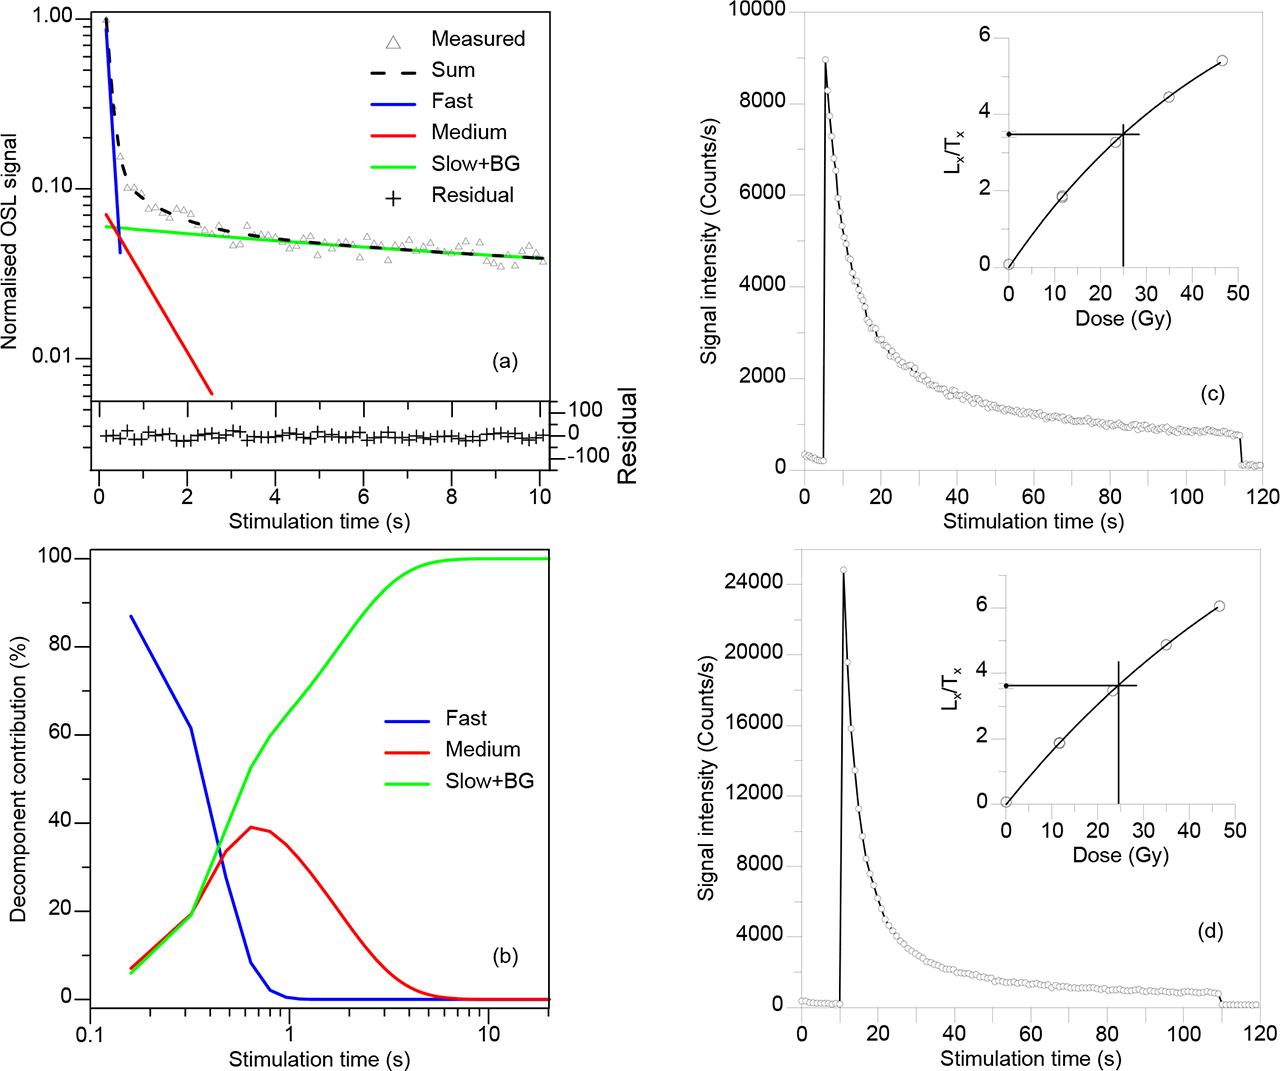
The normalized natural OSL decay curve for a representative sample (NL-579) was shown in Fig. 5a; the OSL signals decreased very fast during the first second of stimulation, exhibiting a typical decay curve of quartz minerals. The normalized OSL decay curve can be decomposed into fast, medium and slow components plus backgrounds (BG). For example, the OSL signals from the first 0.48 s of optical stimulation time are dominated by the fast component (Fig. 5b). The dose-response curve of this sample can be well fitted by single saturating exponential function using six regenerative dose points, including a zero-dose for the measurement of recuperation and a recycling point for assessing the sensitivity change correction. The recycling ratios and recuperation for all De measurements further suggest the validity of the SAR protocol to these samples. A vast majority of the recycling ratios are within the range of 0.9–1.1, with a mean of 1.019 ± 0.005 (n=60), and most recuperation values are below 5%.
Fig. 5
(a) The normalized OSL decay curve of sample NL-579 was decomposed into three components, i.e., fast, medium and slow plus BG; (b) the relative contribution of the three components are plotted against stimulation time; decay curves and growth curves of K-feldspar pIRIR150 (c) and pIRIR225 (d) signals for sample NL-579.
The De distributions generally suggest normal Gaussian distribution or only slightly skewed (Fig. 6). Central age model (CAM) was used to calculate the ages for JC section. It has the advantage over the weighted mean of including all the available data without discarding outliers. The summary of the dose rate and age calculation is listed in Table 1. The quartz OSL ages of three samples, range between ∼8.5 ka and ∼6.9 ka, considering the errors.
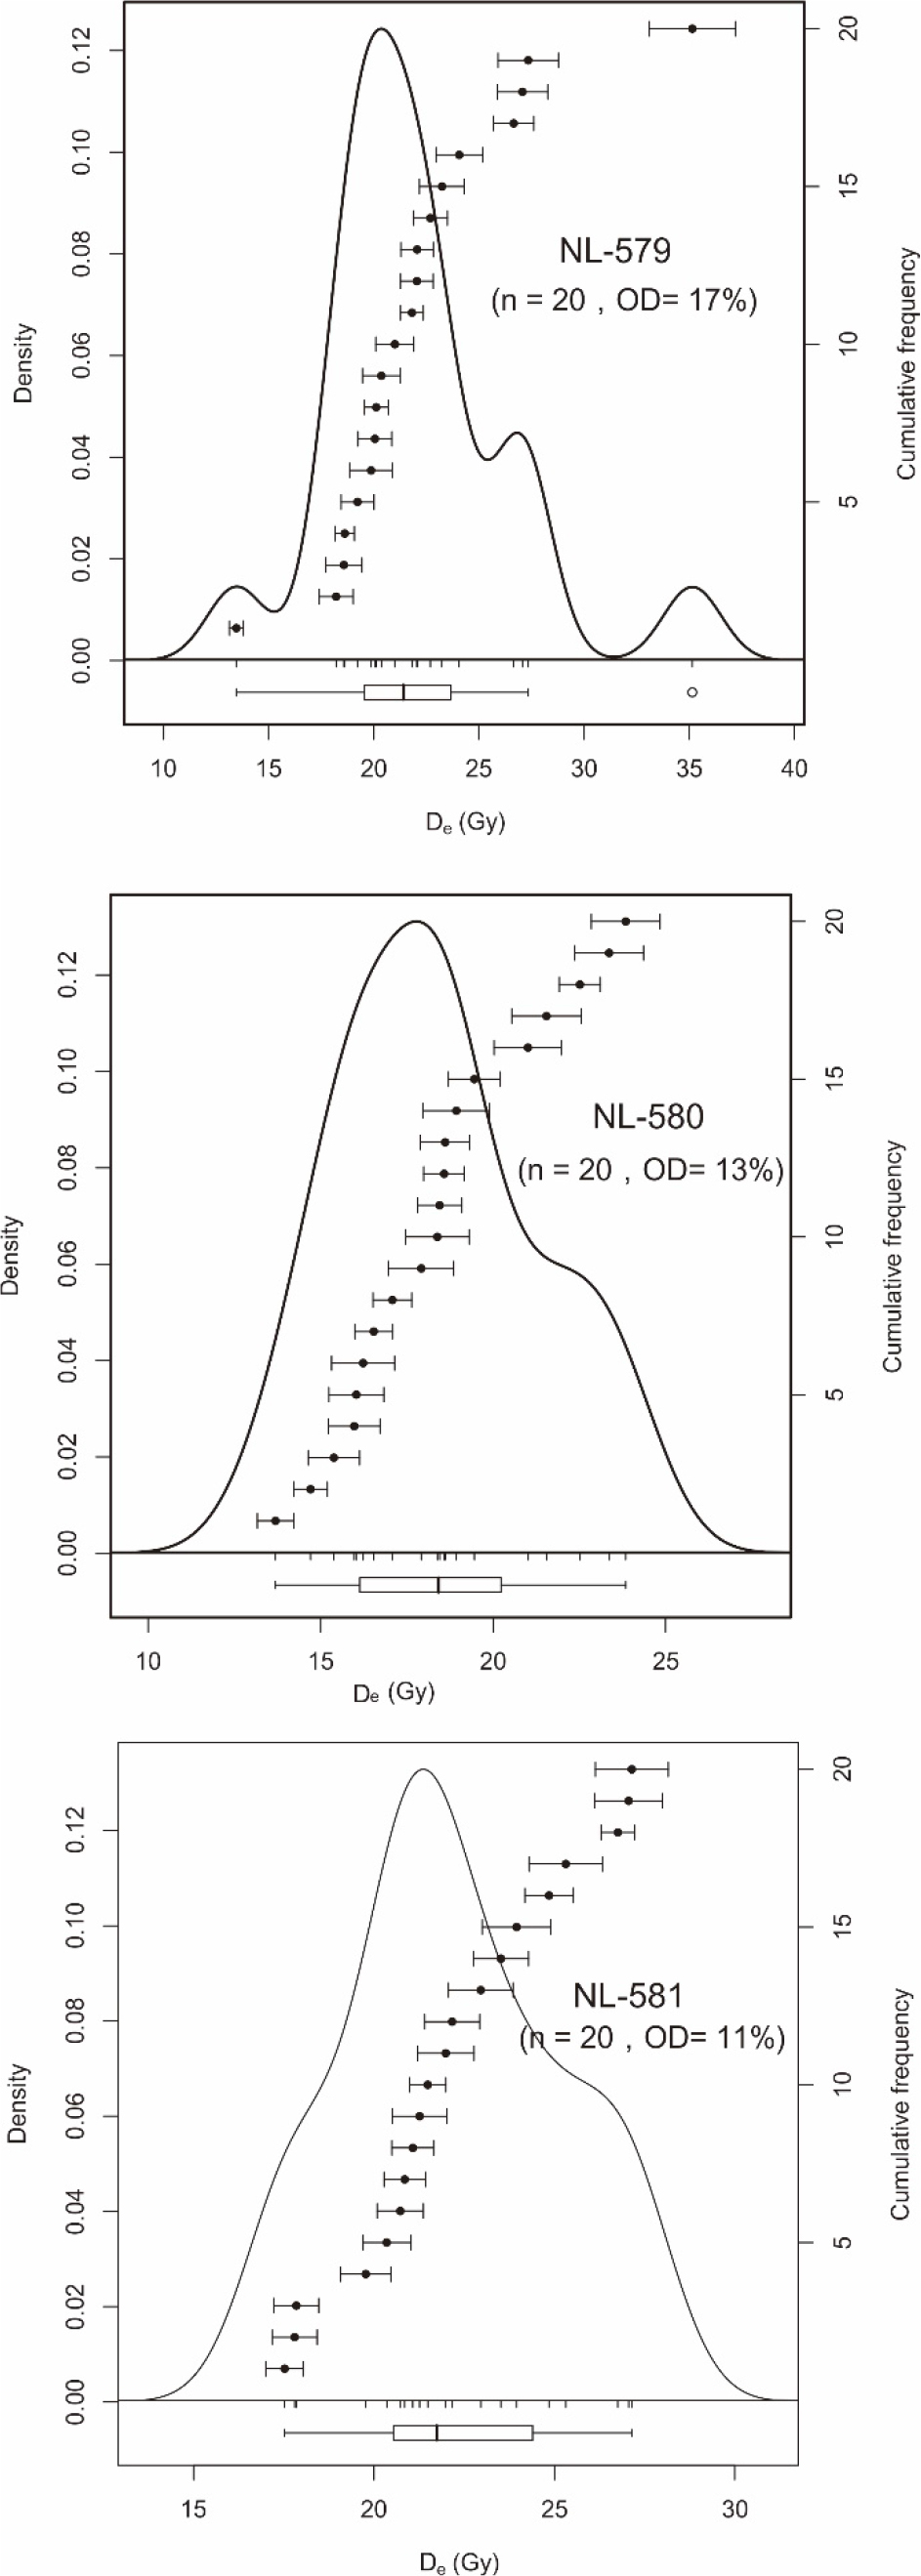
Table 1
Luminescence dating results for three samples.
K-feldspar pIRIR ages
Fig. 5c and 5d show the natural decay curves of pIRIR150 and pIRIR225 signals for sample NL-579 together with the corresponding dose-response curves. The efficiency of both pIRIR150 and pIRIR225 protocols was tested using routine performance tests. Following Zhang et al. (2015), the aliquots were bleached for 4 hours in a solar simulator lamp (Hönle SOL2). They were then given a known dose of ∼23 Gy for dose recovery test of pIRIR150 and pIRIR225 protocols. Most measured-to-given dose ratios for pIRIR signals range from 0.9 to 1.1 after subtracting the residual dose values (Fig. 7a). The mean dose-recovery ratios of pIRIR150 and pIRIR225 signals are 0.994 ± 0.002 (n=9) and 0.917 ± 0.004 (n=9), respectively, suggesting that both protocols can accurately recover the doses given in the laboratory before heating and optical treatment. All these laboratory tests indicate that the overall behaviour of the SAR protocol applied to the pIRIR signals from the samples appears to be satisfactory.
Fig. 7
(a) Dose recovery tests and (b) residual test on K-feldspar pIRIR150 (black) and pIRIR225 (red) signals; (c) fading rates of K-feldspar pIRIR150 (black) and pIRIR225 (red) signals; (d) fading rates of IRSL50 signals measured by pIRIR150 (black) and pIRIR225 protocols.
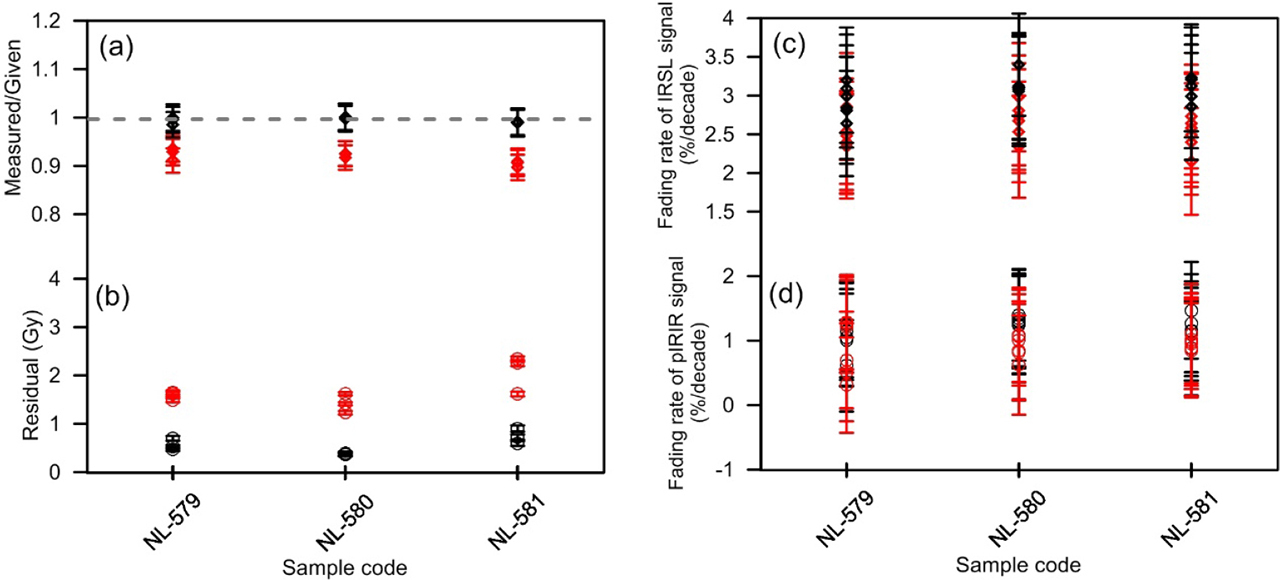
Feldspar signal is bleached slower by daylight than the OSL from quartz, and elevated-temperature IRSL bleaches slower than IRSL stimulated at low temperatures (e.g., Reimann and Tsukamoto, 2012). Therefore, the bleachability of the pIRIR signals, which is of particular importance in luminescence dating of young samples, should be examined. We measured the residual doses after bleaching with a solar simulator. Three discs for each sample were exposed in the Hönle SOL2 for 4 hours, and their residual doses range from 0.3 to 0.9 Gy and from 1.2 to 2.3 Gy for pIRIR150 and pIRIR225, respectively (Fig. 7b), which are equivalent to approximately ∼100–600 years for the studied sediments. Considering that these residual doses are negligible compared with the natural De values of sediments, and the measured residual dose does not represent the true residual dose in nature (Kars et al., 2014), the residual doses were not subtracted from the measured De values for age calculation.
Anomalous fading rate of feldspar luminescence signal is usually quantified by the g-value to represent the luminescence signal loss per decade of normalized storage time (Huntley and Lamothe, 2001). The fading phenomenon is ubiquitous for the majority of feldspars when the IRSL signal is measured at low temperature (e.g., 50°C). In contrast, pIRIR signal could be used to minimize the fading rate to a negligible level. To confirm this, six aliquots for each sample were measured to determine g-values for both pIRIR150 and the pIRIR225 signals as well as the corresponding IRSL50 signals using the method described by Auclair et al. (2003). The g-value of each aliquot was obtained by fitting a linear regression line to the sensitivity-corrected IRSL and pIRIR signals as a function of logarithmic normalized storage time. It shows a pronounced difference in the slopes of the fitted linear function between the two feldspar signals, which is equivalent to the g-value. The mean g-values of pIRIR150 and pIRIR225 of three samples are 1.17 ± 0.05 %/decade and 0.92 ± 0.06 %/decade, respectively (n=18), and the corresponding mean IRSL50 g-values are 3.04 ± 0.04 %/decade and 2.56 ± 0.05 %/decade, respectively (n=18) (Fig. 7c and 7d). It is obvious that the g-values for the pIRIR signal are significantly lower than those derived from the corresponding IRSL50 signal.
We prefer not to correct the pIRIR ages for anomalous fading, even though anomalous fading (g-values) was detected for both pIRIR signals. This is because we consider that such low fading rates of 0.9–1.2%/decade could be a result of laboratory artefact of the fading test measurement, e.g., due to inaccurate sensitivity correction after storage (Buylaert et al., 2012). Previous studies have suggested that corrections based on laboratory-fading rates do not provide accurate age estimates (Li et al., 2008). Furthermore, even standard quartz samples could give a mean g-value of ∼1.0%/decade (Buylaert et al., 2012) (similar to the values for our pIRIR signal), which would predict age underestimates of ∼10% or more. If the pIRIR signal is unstable on a laboratory time scale, it should be similar to the quartz OSL signal, which is generally considered as a stable signal. Thus, our data give evidence that the use of the pIRIR signal can reduce anomalous fading even to a negligible level, and so the equivalent doses derived from the uncorrected pIRIR signal were used for luminescence age calculation.
Following the applied quality tests above, we conclude that the pIRIR protocol is suitable for the determination of De for our K-feldspar samples. The resultant K-feldspar ages are listed in Table 1.
Robustness of luminescence ages and implication for lake highstand
Laboratory tests of luminescence characteristics above verified the suitability of our measurement conditions. However, the bleaching degree of samples is difficult to be assessed when using large aliquots according to these internal examinations. It is well-known that the IR stimulated signals of feldspar bleach slower than the blue stimulated OSL signals from quartz (e.g., Buylaert et al., 2012). Thus, if luminescence ages derived from quartz and feldspar agree with each other, it is unlikely that the quartz signal was incompletely bleached prior to burial (Murray et al., 2012). For an individual sediment sample, the quartz and feldspar fractions have experienced the same transportation and thus same natural bleaching processes. If the quartz OSL signal is not fully zeroed, the feldspar counterpart must have much larger residual dose and consequently give an older age than the quartz fraction. This approach have been successfully applied to various depositional environments (e.g., Long et al., 2019). For the three samples in this study, the quartz OSL ages of the three samples are in good agreement with the K-feldspar ages derived from both pIRIR150 and pIRIR225 signals (Fig. 8), indicating that the quartz OSL signals have experienced complete reset prior to deposition.
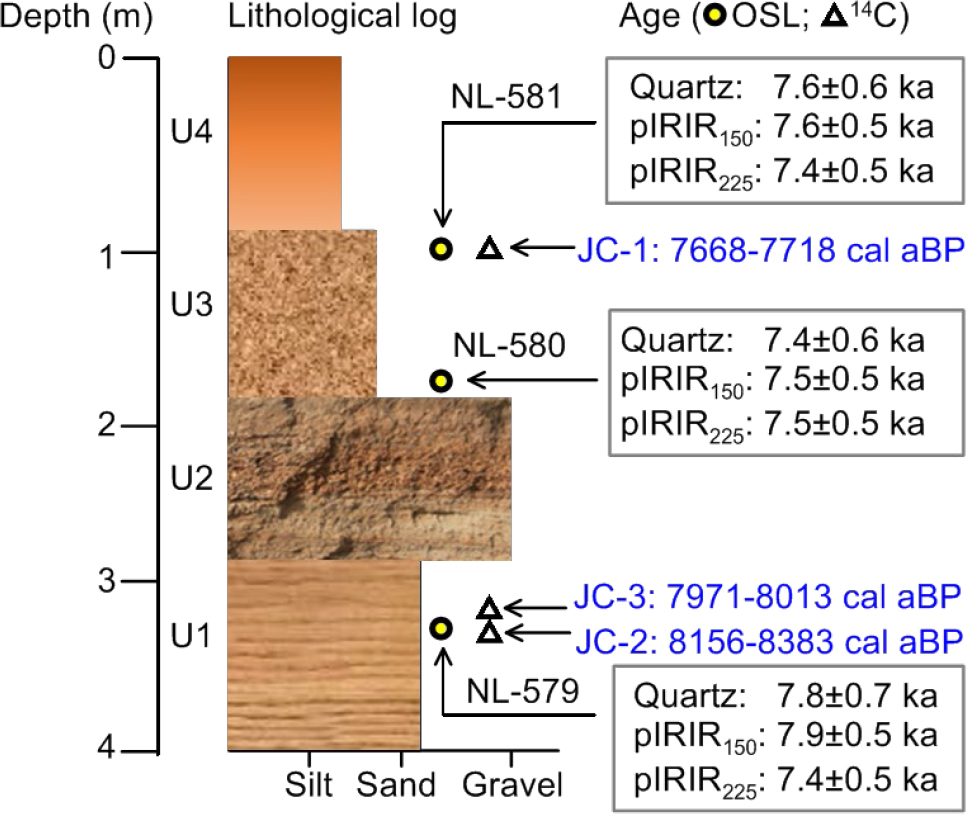
Furthermore, the reliability of luminescence dating results can also be validated by independent radiocarbon age control (Table 2). Terrestrial macrofossils (e.g., charcoals) can yield reliable 14C dates for lake sediments (Edwards and Whittington, 2001). Sample NL-579 yields an OSL age of 7.8 ± 0.7 ka, which is agreeable (within errors) with the 14C age of the charcoal sample (JC-3, 7971–8013 a BP) collected from the horizon overlying the OSL sample (Fig. 8). On the other hand, the accuracy of the OSL ages confirms that the assumed water content value (10%) used for dose rate calculation, is realistic for the beach sediments in the study. It is noted that the 14C ages of charcoal (JC-3) and shell (JC-2) in the neighbouring layers have a difference of ∼200 a, which is probably attributed to a small reservoir effect on shell carbonate 14C age. Our previous study (Long et al., 2011) from the Qingtu Lake (nearby Jinchang paleolake) also showed that the hard water reservoir effect of 14C samples was small, indicated by an apparent agreement between OSL and 14C chronology of the lacustrine sediment, as well as consistent 14C ages dated with different materials (organic and inorganic carbon).
Table 2
14C dating results of three samples.
| Sample ID | Lab ID | Dating material | 14C ages | Calibrated ages (Cal a BP) (one Sigma) |
|---|---|---|---|---|
| JC-1 | NZA57145 | Shells | 6868±26 | 7668–7764 |
| JC-2 | NZA47526 | Shells | 7426±139 | 8156–8383 |
| JC-3 | NZA57104 | Charcoals | 7189±29 | 7971–8013 |
The luminescence and 14C dates of JC section revealed a lake highstand in Jinchang paleolake, which formed from ∼8.5 to ∼6.9 ka within uncertainties. On the other hand, these three luminescence ages seem to be identical with each other, probably suggesting the fast sedimentation process over the millennial timescales. In contrast, the more precise radiocarbon ages show a slightly increasing trend downward, and also a very short history of sediment accumulation spanning ∼500 years. Such small time duration can not be identified by OSL dates because of larger uncertainties. It is comparable with the Holocene high lake-level during the time period of ∼8–6 ka in the neighboring Baijian Lake (Fig. 1, Long et al., 2012). For the closed lakes from the monsoonal margin, the lake level history reflected the regional moisture condition variations, which in turn related to the strength of Asian summer monsoon (e.g., Sun et al., 2009; Zhang et al., 2016). This highstand event in Jinchang paleolake seems comparable to other Holocene moisture records from the adjacent areas. Based on pollen assemblage and concentration analysis on a lake core, Xiao et al. (2004) reported the wettest stage of 7.9–5.1 ka BP followed by a drying trend in Daihai Lake. Similarly, the Holocene moisture sequence derived from the pollen data of a lacustrine sedimentary section in Tengger Desert suggested that it was relatively wet at 7.2–5.2 ka BP (Zhao et al., 2008). Based on luminescence dating of several sections from the Mu Us Desert, Otindag Desert and Horqin Desert, it is revealed that sand dunes were mobile at 11.5–8 ka and stabilized at 8.0–6.0 ka, indicating low effective moisture during the Early Holocene and a relatively wetter middle Holocene (Mason et al., 2009). The lake high-stand in Jinchang paleolake in this study demonstrated Holocene moisture optimum at around 8.5–6.9 ka, which is generally in line with the previous studies in the adjacent area.
. CONCLUSION
We conducted a comprehensive study of luminescence and radiocarbon dating on a shoreline beach ridge in Jinchang paleolake from the NE Tibetan Plateau foreland. The consistent quartz and K-feldspar ages suggested the sufficient bleaching of OSL signals prior to deposition for the water-lain sediments in the study area; the reliability of the luminescence ages was further confirmed by the independent 14C ages. The chronology obtained by both luminescence and 14C dates manifested that Jinchang paleolake has experienced a lake highstand period from ∼8.5 to ∼6.9 ka. We considered it as evidence of increased regional moisture in that period over the Asian summer monsoon marginal areas.