
. Introduction
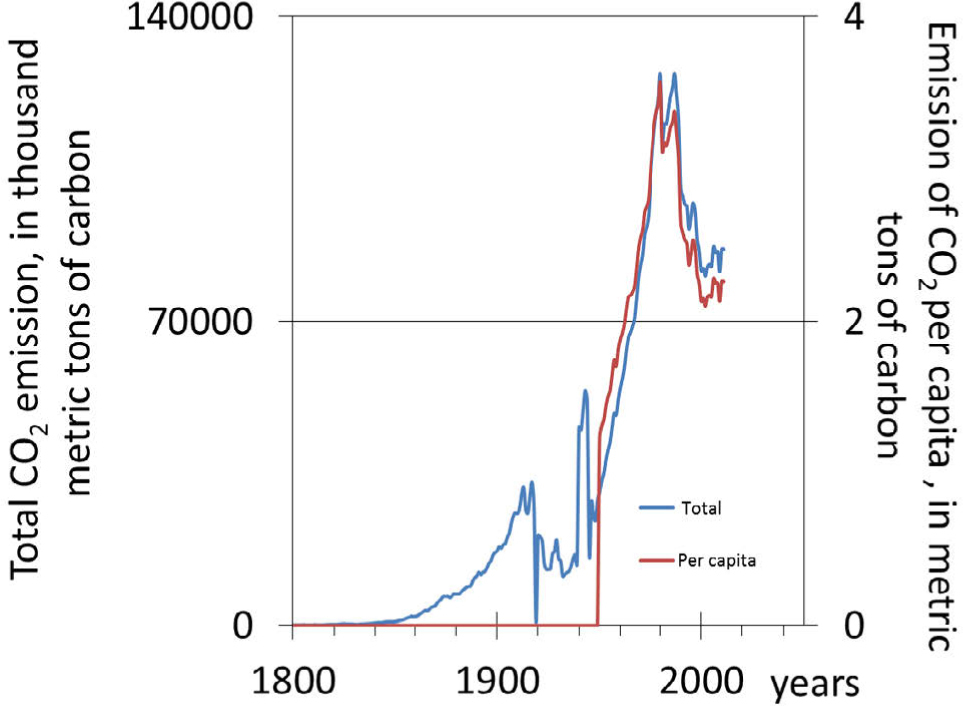
Anthropogenic emissions of pollutants modify air quality and soil chemistry. Sulfur dioxide, nitrogen oxides, carbon oxide, fine particulate matter such as soot, dust and emissions from factories and diesel vehicles are the major air pollutants. The input of pollutants to the atmosphere has increased significantly since the middle of 20th century due to increased industrial activities all over the world. In Poland the highest levels of dust and gaseous pollutants were recorded in 1980s (Fig. 1. Boden et al., 2016). Since the 1980s, pro-ecological policy and pro-ecological investments were implemented in most of the factories in Poland, similarly as in Eastern and Central Europe. Further reduction of contamination emission was connected with restrictive governmental regulations on emissions according to EU legislation.
Fig. 1
National level of carbon emissions from the 1850–2011 period (the emission estimates are expressed in thousand metric tons of carbon, per capita emission estimates are expressed in metric tons of carbon)
The observed anthropogenic impact on the environment causes change in the elemental composition of the atmosphere and the biosphere. It affected on major limiting factors that controlled the functioning of many ecosystems (Vitousek et al., 1997), the condition of forests and trees physiology (Breymeyer, 1998). Pine (Pinus silvestris L.) has been used in bio-monitoring studies (De Vries et al., 2000; Lombardo et al., 2001; Juknys et al., 2003; Wilczyński, 2006; Pearson et al., 2006; Danek 2007; Sensuła et al., 2011a, 2011b; Sensuła and Wilczyński, 2017). However there is still a lack of data concerning the environmental changes in the most industrialized part of Poland over the last century. In this study we use tree-rings widths as indirect archives of environmental pollution. This study reports also the elemental trace concentration in annual tree rings of pine growing nearby chemical factories in Kędzierzyn-Koźle during the period of industrial development and implementation of pro-ecological policy in Poland.
The main objectives of this study were: to analyze (1) record of historic pollution in tree-ring and (2) biological adaptation to pollution of pine growing nearby chemical factories in Kędzierzyn-Koźle during the period of industrial development and pro-ecological policy implementation in Poland.
Trees as bio-indicators
Trees can provide annual records of ecosystem changes connected with human activity over several decades. These changes can be recorded in the pattern of variation of tree-rings widths and in the variation in the elemental composition of wood. In the literature, there has been much discussion about yearly variation of heavy metals, micronutrients and macronutrients, stable isotopes and radiocarbon in tree rings and needles linked to a common anthropogenic source (Prohaska et al., 1998; Kuang et al., 2008; Parn and Madre, 2011; Beramendi-Orosco et al., 2013; Pazdur et al., 2013, Sensuła and Pazdur, 2012, 2013a, 2013b; Sensuła et al., 2011a, 2011b; Sensuła, 2015, 2016a, 2016b). Scientific literature reviews have shown that the trees which grow under pollutant pressure have reduced diameter and height increments (Mielikäinen and Sennov, 1996). Their incremental natural rhythm of growing is disturbed and their sensitivity to climate changes is limited (Elling et al., 2009). The biological effects of pollutants stress on trees depend on the species and age of trees and the habitat condition where they grow (e.g.; Danek 2007; Malik et al., 2012; Sensuła et al., 2015a, 2015b).
Different methods of dendrochronological analysis were often used to evaluate the impact of pollution on the potential incremental trees (McLaughlin et al., 2002; Bascietto et al., 2004; Battipaglia et al., 2009; Eckstein and Schweingruber, 2009), A number of studies have investigated: the rate of trees with different degrees of growth reduction to the diameter and height (Kienast, 1985; Schweingruber, 1986; Danek, 2007; Elling et al., 2009; Malik et al., 2012; Crecente-Campo et al., 2010), differences in similarity in radial growth response of trees (Wilczynski, 2006). Scientific literature reviews have shown that, the size of reduction also depends on the distance from the source of pollution, directions prevailing winds and area orography (Krąpiec and Szychowska Krąpiec, 2001; Juknys et al., 2003, 2014; Wilczyński, 2006; Elling et al., 2009; Malik et al., 2012; Rydval and Wilson, 2012; Bošela et al., 2014).
It has been observed that trees intercept and absorb air pollution from the atmosphere (Nowak et al., 2006). Reported that trees can also reduce air pollutants (i.e. particulate matter, volatile organic compounds) that are detrimental to human health and contribute to more complex air quality problems The integrated studies of tree effects on air pollution reveal that management of urban tree canopy cover could be a viable strategy to improve air quality and help meet clean air standards (Nowak et al., 2006).
Trace elements
Trees of temperate regions, such as Europe, usually form visible annual growth rings, which can be dated accurately. It is possible to collect wood samples of different age and analyze its heavy metal content in order to get a chronological record of trace element pollution in the tree environment (Nabais et al., 1999). The elements can be emitted into the environment from transportation, industry, fossil fuels burning, agriculture, and other human activities. There have been several studies that successfully monitored the trace elements in different tree components such as bark, leaf, needle, and leaf litter (Watmough and Hutchinson, 1996; Alloway and Ayres, 1997; Prohaska et al., 1998; Adriano, 2001; Prasad et al., 2006; Dogan et al., 2007; Jelaska et al., 2007; Tuna et al., 2013). Element uptake through the roots can be influenced by the sapwood-heartwood concentration equilibrium, the quantity of macronutrients versus metals, ion solubility, soil type, and pH (Padilla and Anderson, 2002).
The uptake of heavy metals by pine is a complex process and its efficiency depends on the soil pH, redox potential, soil texture, soil organic matter content, soil metal content and metal availability (Seregin and Ivanov, 2000; Baltrnait and Butkus, 2007). The acid rain may have a strong effect on specific element mobility in the soil and plant uptake (Padilla and Anderson, 2002). For example, Pb is absorbed by trees mainly on acid soils and not on basic soils (Leonelli et al., 2011).Scientific literature reviews shown that different elements are important in plants physiology. Sodium (Na) is not an essential element for plants but can be used to help in metabolism and synthesis of chlorophyll. In some plants, it can help in the opening and closing of stomata to regulate internal water balance. The fundamental role of magnesium (Mg) in the plant is linked to the presence of chlorophyll molecules, and therefore the influence of the photosynthetic processes. In addition, magnesium is activated and regulates the enzymes in the plant nitrogen. Magnesium is important in shaping the quality of plant products in terms of their nutritional value for animals and humans (Kabata-Pendias and Pendias, 1979, 1993). Chromium (Cr) was found to be a stimulant for plant growth (Gericke, 1943). Herbert (1907) reported toxic effect of chromium on plants. Iron (Fe) is needed to produce chlorophyll. The function of iron is to help to carry important elements through a plant’s circulatory system. Iron deficiency is a limiting factor of plant growth (Kabata-Pendias, 2011). Also nickel (Ni) is an element necessary for the proper behavior of certain physiological processes in plants, and it also plays an important role in the regulation of the binding of free nitrogen by soil bacteria. Copper (Cu) is an essential element in the metabolism of plants. It is involved in the regulation of the generative processes of plants, photosynthesis and respiration (Mengel and Kirkby, 1982). The bioavailability of copper to plants depends largely on factors such as pH and organic matter content. Zinc (Zn) is an essential element for the proper functioning of plants and animals. This element is essential for the functioning of many enzymes, responsible for the metabolism of proteins and carbohydrates, and it is also affected by photosynthetic activity (Kabata-Pendias, 2011). Lead (Pb) in no essential element for plants and but to high Pb concentration in the environment may cause a number of toxicity symptoms in plants e.g. stunted growth, chlorosis or inhibits photosynthesis. Lead concentrations in the tree rings have been widely studied because of its relation to health and because of the low solubility of Pb. According to current knowledge (Chaney et al., 2000; Kabata-Pendias, 2011), only elements such as cadmium, lead, arsenic and mercury do not play any physiological function, but high concentration can be toxic to the plant. Different tree species may react or not react, very independently to pollution from heavy metals in the environment.
The consequences of soil contamination are risks associated with the migration of contaminants to other components of the environment — water and air. Introduction of potential harmful trace metals into the soil involves interaction with the biological processes occurring in the soil and their excessive uptake by plants (Baath, 1989; Chaney and Oliver, 1996), although there is considerable variation between metals in terms of the environmental impact of soil pollution. The industrial pollutant emissions could potentially influence tree ring width and elemental composition of wood and occurs during physiological processes responsible for plant growth.
. Materials and methods
Research area
Kędzierzyn-Koźle is one of the most industrialized cities of Opole province. Factories operating in the city are of strategic importance to the region and the country. In this urban area, heavy metals are emitted from numerous anthropogenic sources including industrial processes, such as production of fertilizers, cement-lime and refractory materials, fugitive emissions from pollutants and traffic. Kędzierzyn-Koźle is located near two complex factories: Blachownia Holding s.a. (ancient and common name: Blachownia Chemical Factory) and nitrogen factory Grupa Azoty ZAK (ancient and common name: Zakłady Azotowe Kędzierzyn-Koźle, ZAK).
Blachownia Chemical Plant was a remnant from the ancient tradition of the iron and steel rolling. However, chemical production began in 1941, when it commissioned the German army Oberschlesische Hydrierwerke company to build a factory producing synthetic liquid fuels (petrol and diesel aircraft). In 1957, a power plant was launched.
The nitrogen factory ZAK has been one of leaders in the group of Polish producers of nitrogen fertilisers and other chemical products. This company was built on the ruins of another factory destroyed by warfare and the production restarted in 1954.
In both factories, many different units and production facilities were constructed and added over a period of last 60 years. Since the 1980s, numerous projects dedicated to environmental protection were implemented in both factories. After many years of trying to minimize the negative impact of production processes on the environmental, these factories were struck off the list of the most environmentally noxious factories. In 2004, Waste Management Plan for the City of Kędzierzyn-Koźle set strategic objectives for 2015: the implementation of low and nonwaste technologies and best available techniques (BAT) and the introduction of the principles of “cleaner production”.
Sampling
Scots pine (Pinus sylvestris L.) is the main tree species in the forest and thus pine was selected for this study. The pine sites are located at a similar altitude above sea level and the trees were growing in similar habitats (Table 1) but at different distances from the industrial factories (Fig. 2). Twenty cores of dominant trees were taken with Pressler’s borer at breast height from each of 6 tree sampling sites. One increment core from each tree was taken for dendrochronological analysis.
Fig. 2
Sampling sites (A, B, C, N, S, T) in the vicinity ot the nitrogen factory: Grupa Azoty ZAK (ZAK) and chemical factory Blachownia Holding s.a (Blachownia) in the southern part of Poland; and dominant wind direction.
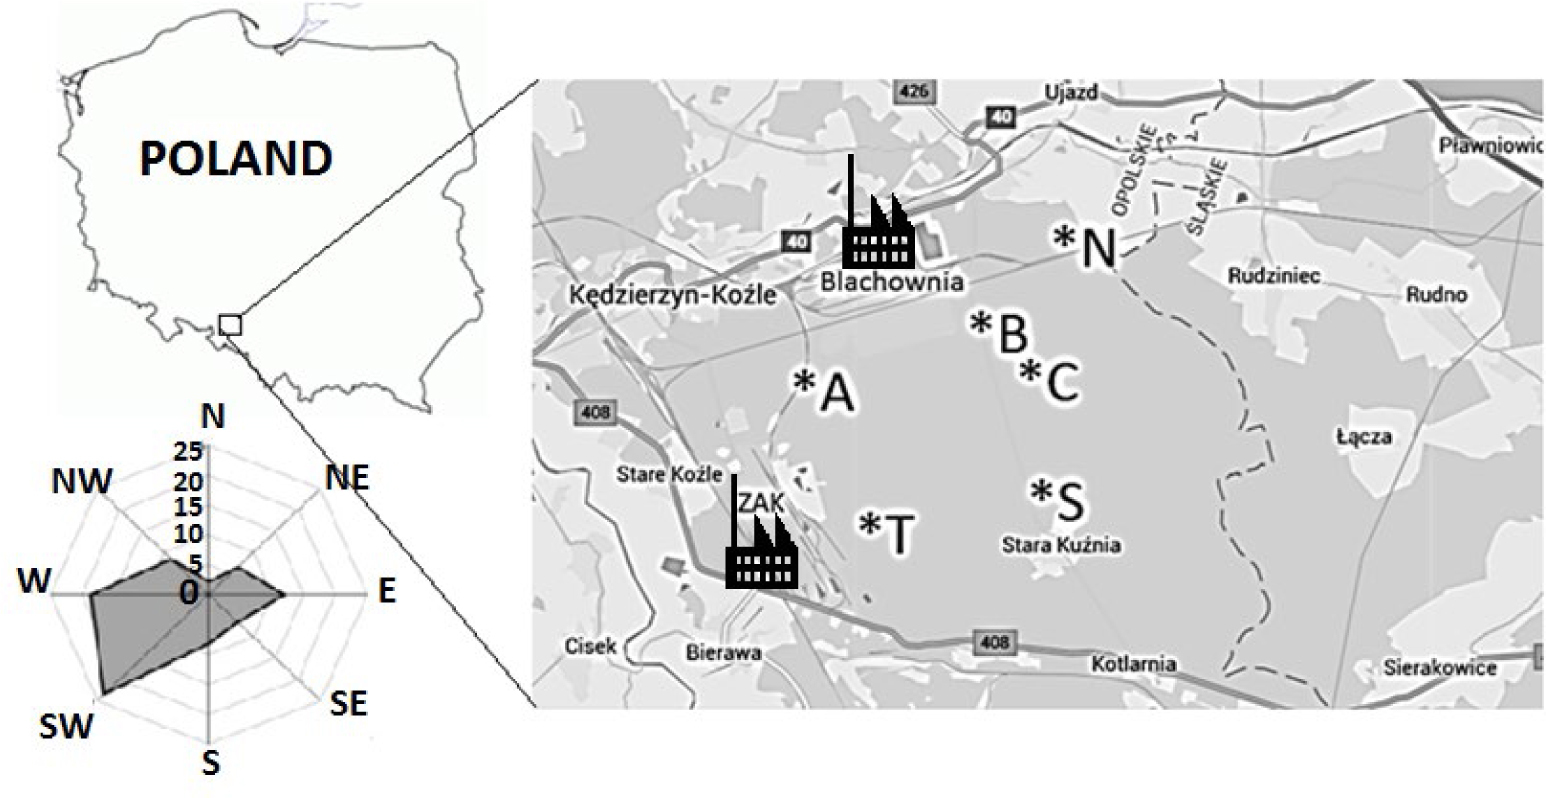
Table 1
Sampling site – geographical coordinates, elevation and forest type (FMB – fresh mixed broadleaved forest).
| Site code | Lat. N; Lon. E | Elevation (m) | Forest site type |
|---|---|---|---|
| A | 50°19’; 18°15’ | 192 | FMB |
| B | 50°20’; 18°18’ | 209 | FMB |
| C | 50°20’; 18°19’ | 218 | FMB |
| N | 50°22’; 18°23’ | 218 | FMB |
| S | 50°18’; 18°20’ | 215 | FMB |
| T | 50°18’; 18°17’ | 207 | FMB |
The examined specimens were healthy and grew in the similar habitat conditions. All tree sampling sites were classified as a fresh mixed broadleaved forest site. In order to avoid different dendroecological reaction of juvenile wood, an attempt was made to select pine stands aged 80–100 years which is the felling age of Scots pine.
Standardization of tree-ring and determination of reduction periods
Firstly, tree-ring widths were measured. Next, they were dated and rechecked using the Cofecha computer program (Holmes, 1983). Medium-time fluctuation in tree ring width can result from periodical variation of the influence of pollutants. To remove age-related trends in the radial growth rate, the use of any tree-ring detrending method is required. The negative exponential curve fitting can be used to model the variation in radial width of coniferous trees. To build the site tree-ring width chronologies, tree-ring width series were averaged for each sampling site. The negative exponential fit curves have been adjusted to each of the chronologies. Next, the RI (radial increment index) was calculated as the ratio of real annual increments and their model values. RI indicates the relative value of radial growth compared to model values of growth.
The long-term periods of reduction of radial growth of trees have been designated for each population. The reductions periods corresponds to the incremental indexes (RI) lower than 1. Lower and higher value corresponds to the reduction of tree ring width.
Changes of Index (CI) were calculated as the difference between the RI values in two consecutive years. The parameters (TRW, RI and CI) were averaged for three periods of time (1) – before reduction, (2) – during reduction, and (3) – for the recovery period.
The degree of similarity of short-term incremental reactions in trees of each partial population was evaluated by calculating the mean correlation of standardized series of trees (rbt). rbt indices measure the signal strength of the chronology. rbt can be used to calculate the index expressed population signal (EPS). EPS — the expressed population signal — is a statistic for examining the common variability in chronology and it is dependent upon the sample depth (Wigley et al., 1984; Briffa and Jones, 1992). rbt and EPS were calculated for two periods of time: (1) between 1940 and 2012 (2) common period of reduction from 1962 to 1989.
Classification of pine populations. Pointer years
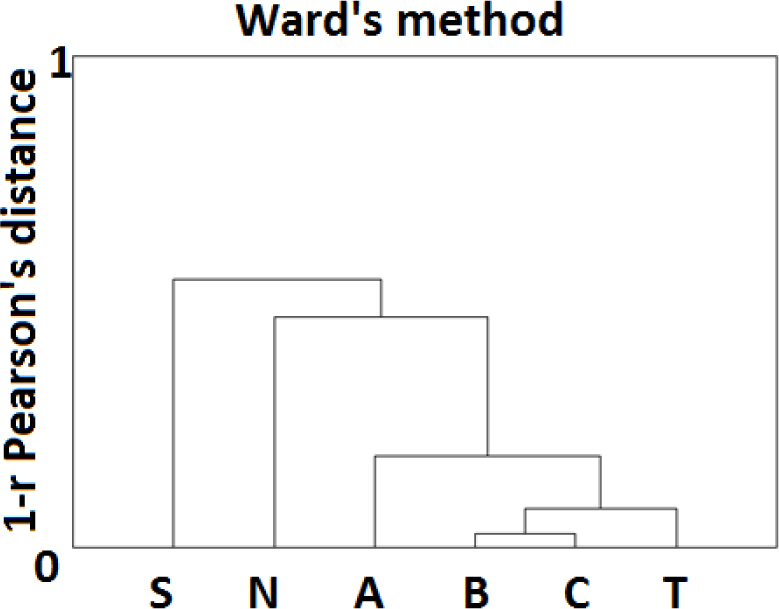
Cluster analysis was used to analyse similarity in radial growing of each pine population in the period of time between 1940 and 2012 (Fig. 5). The variables were site indexed chronologies.
Fig. 3
Site tree-ring width chronologies (lines), site indexed chronologies (grey area), and negative exponential fit curves. In the bracket there is a reduction period of time.
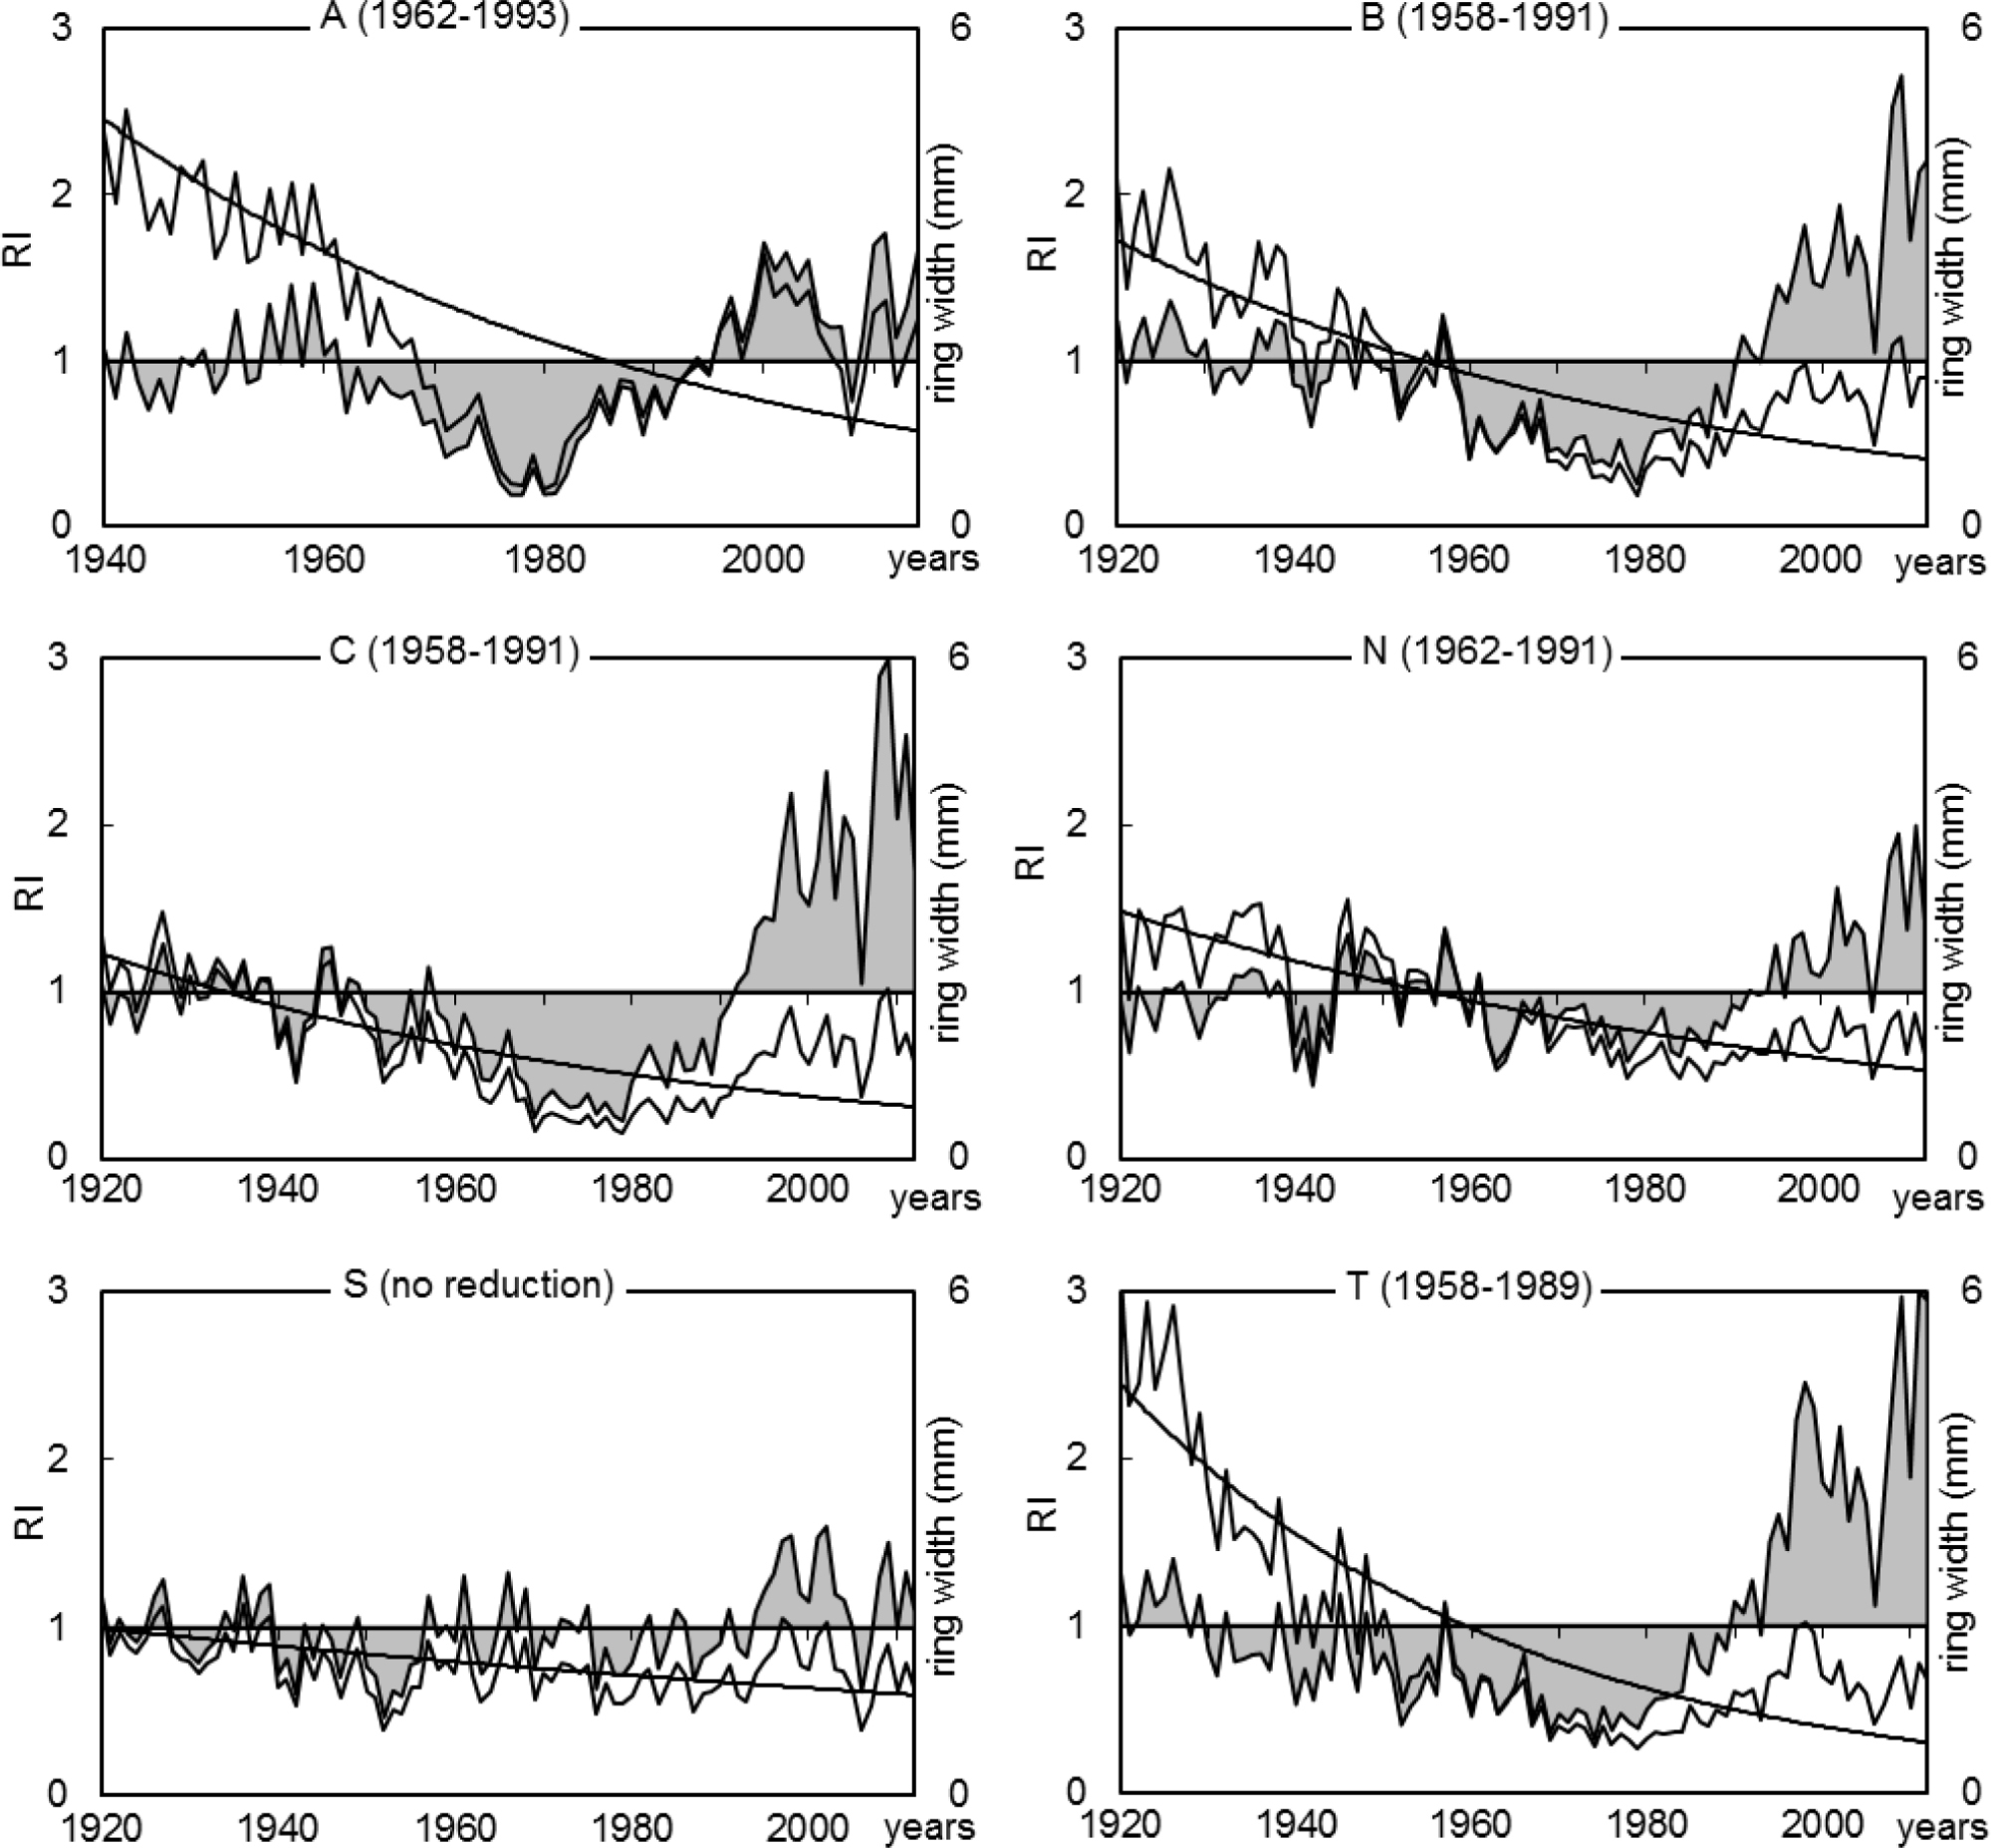
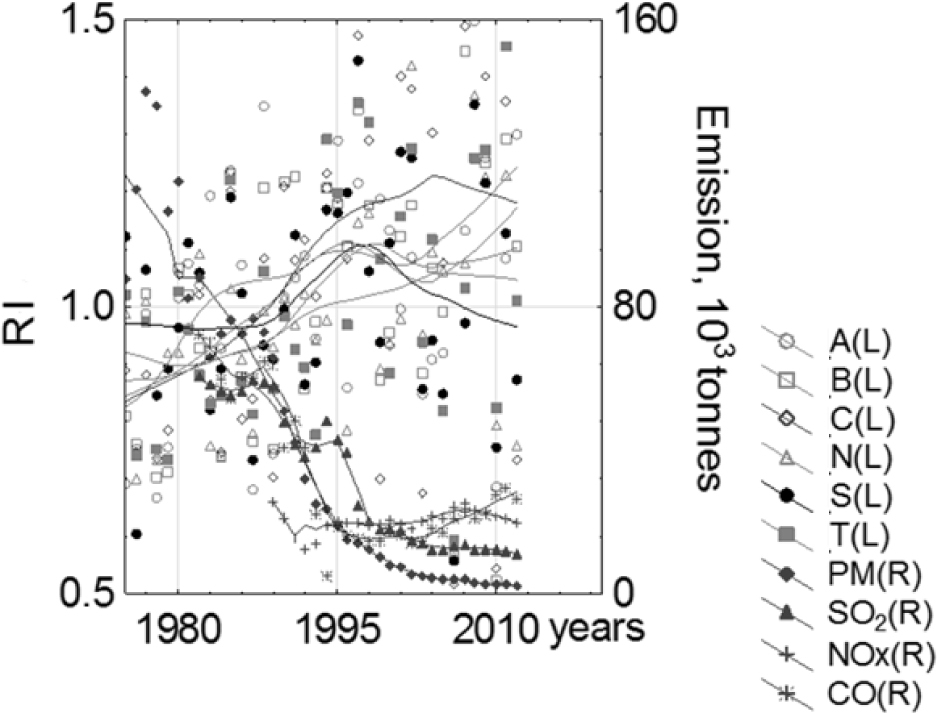
Fig. 4
Decrease of the level of air pollution (PM, SO2, NOx and CO) in Opole voivodship (R-right axes) and increase of trees indexed chronologies since 1970s (L-left axes). Sampling sites: A, B, C, N, S, T.
The IT indicators (interval trend indices, expressed in %) were calculated for all the analysed tree-ring width series (Schweingruber et al., 1990).
where: m – the number of trees in which TRW in current year is greater than TRW in the previous year, n – total number of investigated trees.
A higher value of IT corresponds to the degree of homogeneity of the incremental response of trees in a given year. IT equal to 100% means that all the trees increased the size of the radial growth compared to the previous year (Schweingruber et al., 1990; Meyer, 1998–1999). IT equal to 0% means that all the trees decreased the size of the radial growth compared to the previous year. IT equal to 50% means that the half of the investigated population of trees decreased the size of the radial growth compared to the previous year, and the half of the investigated population of trees increased the size of the radial growth compared to the previous year.
Modern environmental pollution data
The current quantitative emission rate information for existing sources available from public sources has been reviewed. The emission data were obtained from Statistical Yearbooks of the Environmental Protection 1975–2012, and CDIAC date base (Boden et al., 2016). Data on environmentally quality indicating the amount of pollutants found per unit volume (the air pollutant concentration and wet pollutants deposition) were obtained from the archives kindly provided by GIOŚ (Główny Inspektorat Ochrony Środowiska) and EIONET at Central Data Repository. These data are limited to the period of time since 1996. The level of gaseous pollution in Poland is presented in Fig. 1., and the level of gaseous pollution in Opole Vojewodship is presented in Fig. 4.
Elements concentration determination
Tree cores (C_2013 and C1_12) of two healthy pines collected from the research area (site C) were analysed for the total concentration of the following elements: 23Na, 26Mg, 56Fe, 60Ni, 65Cu, 66Zn, 208Pb. One core was used as a comparative sample. The C_2013 covered the period of time since 1920s until 2012, whereas a part of comparative sample (C1_12) covered the period of time since 1995.
Radial trace-element profiles were determined by Laser Ablation Inductively Coupled Plasma-Mass Spectrometry (Laser ablation: New Wave Research UP-193 FX Fast Excimer, ICP-MS: Thermo Scientific X-Series2 with CCT -Collision Cell Technology) at Royal Museum for Central Africa (Belgium). LA-ICP-MS provides a repeatable, minimally destructive, sensitive method for determining many elements in wood tissue, with relatively high spatial resolution (Hall et al., 1990, Hoffmann et al., 1994).
Laser ablation system produces craters in the sample ranging in size 10 microns. The ablated material was then swept by an He-Ar flow from the sample cell directly into the plasma of the ICP-MS. The sample particles were then ionized and the ions are separated and detected by the mass spectrometer.
The measurement were made in continuous ablation with 100-μm line at a speed of 15 μm/s. The spatial resolution is 14 μm between each measurement. The laser was fired with energy of 10 J/cm2 and a repetition rate of 40 Hz. Before analysis, the operating conditions of LA-ICP-MS were optimized by ablation on the standard reference material NIST SRM 612 (from National Institute of Standards & Technology, US). Two certified reference materials (MACS-1 and MACS-3 (from United States Geological Survey)) were used for the calibration and also analyzed with each series of samples to control the instrumental drift. The precision was below 10% and the accuracy was better than 6%. Total elements blanks were negligible and below their limit of detection (0.7 μg g−1 for Na, 0.4 μg g−1 for Mg, 0.4 μg g−1 for Fe, 0.2 μg g−1 for Ni, 0.15 μg g−1 for Cu, 0.1 μg g−1 for Zn and 0.01 μg g−1 for Pb). The limits of quantification were calculated from the intensity and standard deviation measurements of 20 blanks. 13C was used as internal standard and assumed to be 45% (in concentration). The radial trace-element profiles were rechecked, smoothed for spike removal and fit to annual tree-rings width. The median was used in analysis, because a median is a more outlier-resistant measure of a distribution’s center than is the arithmetic mean.
. Results
Dendrochronological analysis
The values of rbt index fell over the period 1962–1989 in relation to the entire period in question (Table 2). The strongest declines in rbt were found at sites B, C and T. The values of EPS were also lower in this period but they remained at a relatively high level — above 0.9. This was the result of a large number of series (20), which had an impact on the value of the EPS.
Table 2
Selected dendrochronological statistics. MTRW (mean tree-ring width), MRI (mean relative radial increment), and MCI (mean change of index) were calculated for 3 periods: (a) before reduction, (b) during reduction, (c) during recovery; rbt – the mean between-tree series correlation, EPS – the expressed population signal is a statistic for examining the common variability in chronology; rbt and EPS were calculated for 2 periods of time: (d) 1940–2012 (total common period, n=73) and (e) 1962–1989 (common reduction period, n=28)
In the investigated area the principal gaseous pollutants are particulate matter (PM), carbon oxides, nitrogen oxides and sulphur oxide. The average concentration of all pollutants levels remained on a downward trend (Fig. 4). In the Opole province sulphur dioxide did not reach air quality standards and achieved levels that persisted well below the limit values for years. In addition, the downward trend lasting several years can be observed in the level of contamination. Particularly high levels are noted for particulate matter concentrations. The analysis of the influence of local air pollution emission on tree rings confirmed the regional (national) negative effect of the increase of CO2 emissions from fossil fuel combustion, the negative effect of increase of the local air pollution emissions (CO, SO2, NOx, dusts) and also the local negative effect of the distribution of air pollution such as NOx, SOx, and dusts from sources near the investigated site.
Indexed chronologies show clearly that in the 60s, 70s and 80s on 4 sites (A, B, C and T) long-term reduction in radial growth has been observed in pines (Fig. 3). During this period, industrial production grew rapidly, and so did pollution. As a result, the levels of industrial immission increased. Pine trees have begun to reduce their growth in thickness. However, this phenomenon was spatially varied.
The most significant reductions were recorded and observed in the tree population closest to factories and in the windiest zone (site B, C, and T). The average radial growth of trees of these populations varied between 53 and 58% of the model growth (Table 2). On site S, pines showed no reduction in radial growth and on site N the growth was 78% of the model growth value. Also on site A (61%), the reduction in growth was smaller than in other locations (Table 2). These sites are located away from industrial centres or outside the zone of southwestern winds which carry the most pollutants (see Fig. 2 and Fig. 3).
In the period before the culmination of industrial emissions, pine radial growth was close to the model one, as evidenced by MRI indicators whose values were close to 100% (ranging from 97% to 100%) of the fitted curve value (Table 2). If pine trees continued to grow according to the model, the MRI values should continue to remain at this level. However, in the period of intense emission the value of this indicator decreased significantly (Table 2).
In the period when emission was at its highest, the sensitivity of trees to environmental conditions, changing from year to year, was also lowered. The biggest declines in the value of the MCI indicator concern the population whose growth reduction was highest (B, C, and T). In contrast, on site S, where no reduction in growth has occurred, the MCI indicator has increased (Table 2).
In the early 1990s there was a strong, long-term increase in radial growth (Fig. 3). This is indicated by the width chronology of tree rings, indexed chronologies and high values of MRI index (Fig. 3, Table 2).
This phenomenon is most marked in the trees which in previous decades showed the greatest reductions (B, C, and T). In recent years, the average growth of pines in these populations has reached 300% of the model growth (Table 2). In the last two decades the annual growth variation has also increased (MCI) (Fig. 3, Table 2).
With the smaller influence of pollutants, the size of the radial growth and sensitivity of trees to short-term environmental impulses started to grow rapidly. The biggest increases in MCI were observed in populations where theirs rate in the previous period was lowest (B, C, and T) (Table 2).
The grouping of the pine population is compatible with the size reduction of their radial growth in the 1960s, 70s and 80s. B, C, and T form a highly homogeneous population group, the radial growth of which during the reduction period was respectively 53%, 56% and 58% of the model growth (Figs. 3 and 5). The level of reduction was therefore the highest in their case. On the other hand, S-site population showed no reduction at all.
In the years 1940–2012 (the common period for the chronology of all the populations), the homogeneity of year-to-year pine incremental response varied significantly (Fig. 6). Uniformity in incremental responses lasted until the early 1960s and again since the late 1990s. This is evidenced by the very large number of site pointer years.
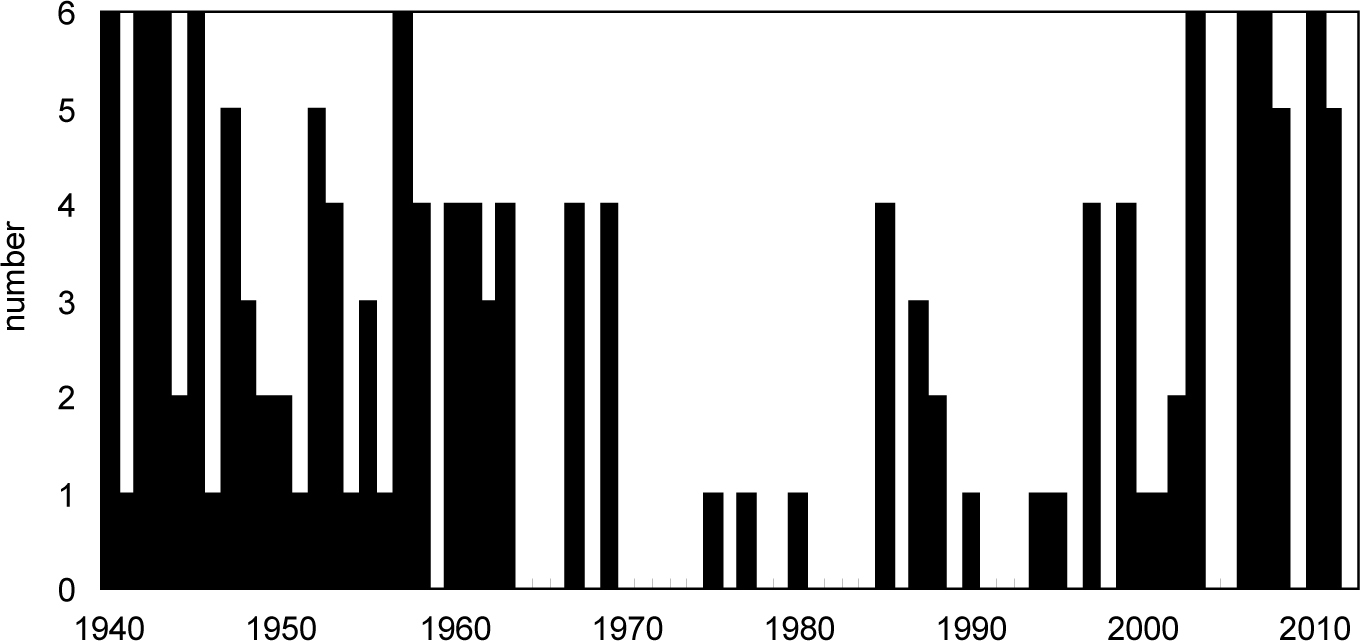
On the basis of the IT values the positive and negative pointer years were determined in the investigated area (positive pointer years corresponds to IT>90%, and negative pointer years corresponds to IT<10%, respectively). This analysis showed short-term dynamics of Scots pine radial growth. The number of pointer years decreased significantly (Fig. 6) in the 1970s, 80s and 90s.
During the 1940–2012 period, pine pointer years occurred simultaneously in 6 populations during one year (Fig. 6). In the period of intense pollution, mainly in the 1970s and 80s, pointer years occurred in a small part of the population. The degree of homogeneity of incremental reactions of pines was diverse as regards both space and time. Before and after this period the homogeneity was much higher (Fig. 6).
Chemical wood composition
Analysis then was made of the variability in the element concentrations among rings within a core, and between cores taken from two trees to verify the results. Temporal variations of element concentration (median) in annual tree-rings of pines were compared with time series of wet deposition of pollutant and air pollutant concentration in the investigated area. For the statistical calculation, Statistica 10.0 software was applied. The analysis of the trace element concentration (Fig. 7) in two tree cores (C1_12 and C_2013) show the order of relative abundance of elements in pines is similar for both samples. The order was: Na>Mg>Fe>Zn>Cu>Pb>Ni in C_2013 and Na>Mg>Fe>Zn>Cu>Ni>Pb in C1_12. Lower annual mean concentration of Na, Fe, Ni, Cu, Zn and Pb was detected in C1_12 sample, whereas Mg concentration was higher in C1_12 sample than in C_2013 sample. Despite that, the similar trends of magnitudes changes can be observed between element concentration (Na, Mg, Fe, Ni) in both pines.
Fig. 7
Comparison of trace elements component (Na, Mg, Fe, Ni, Cu, Zn, Pb) in two wood profiles and total wet deposition or concentration in the rain of these elements.
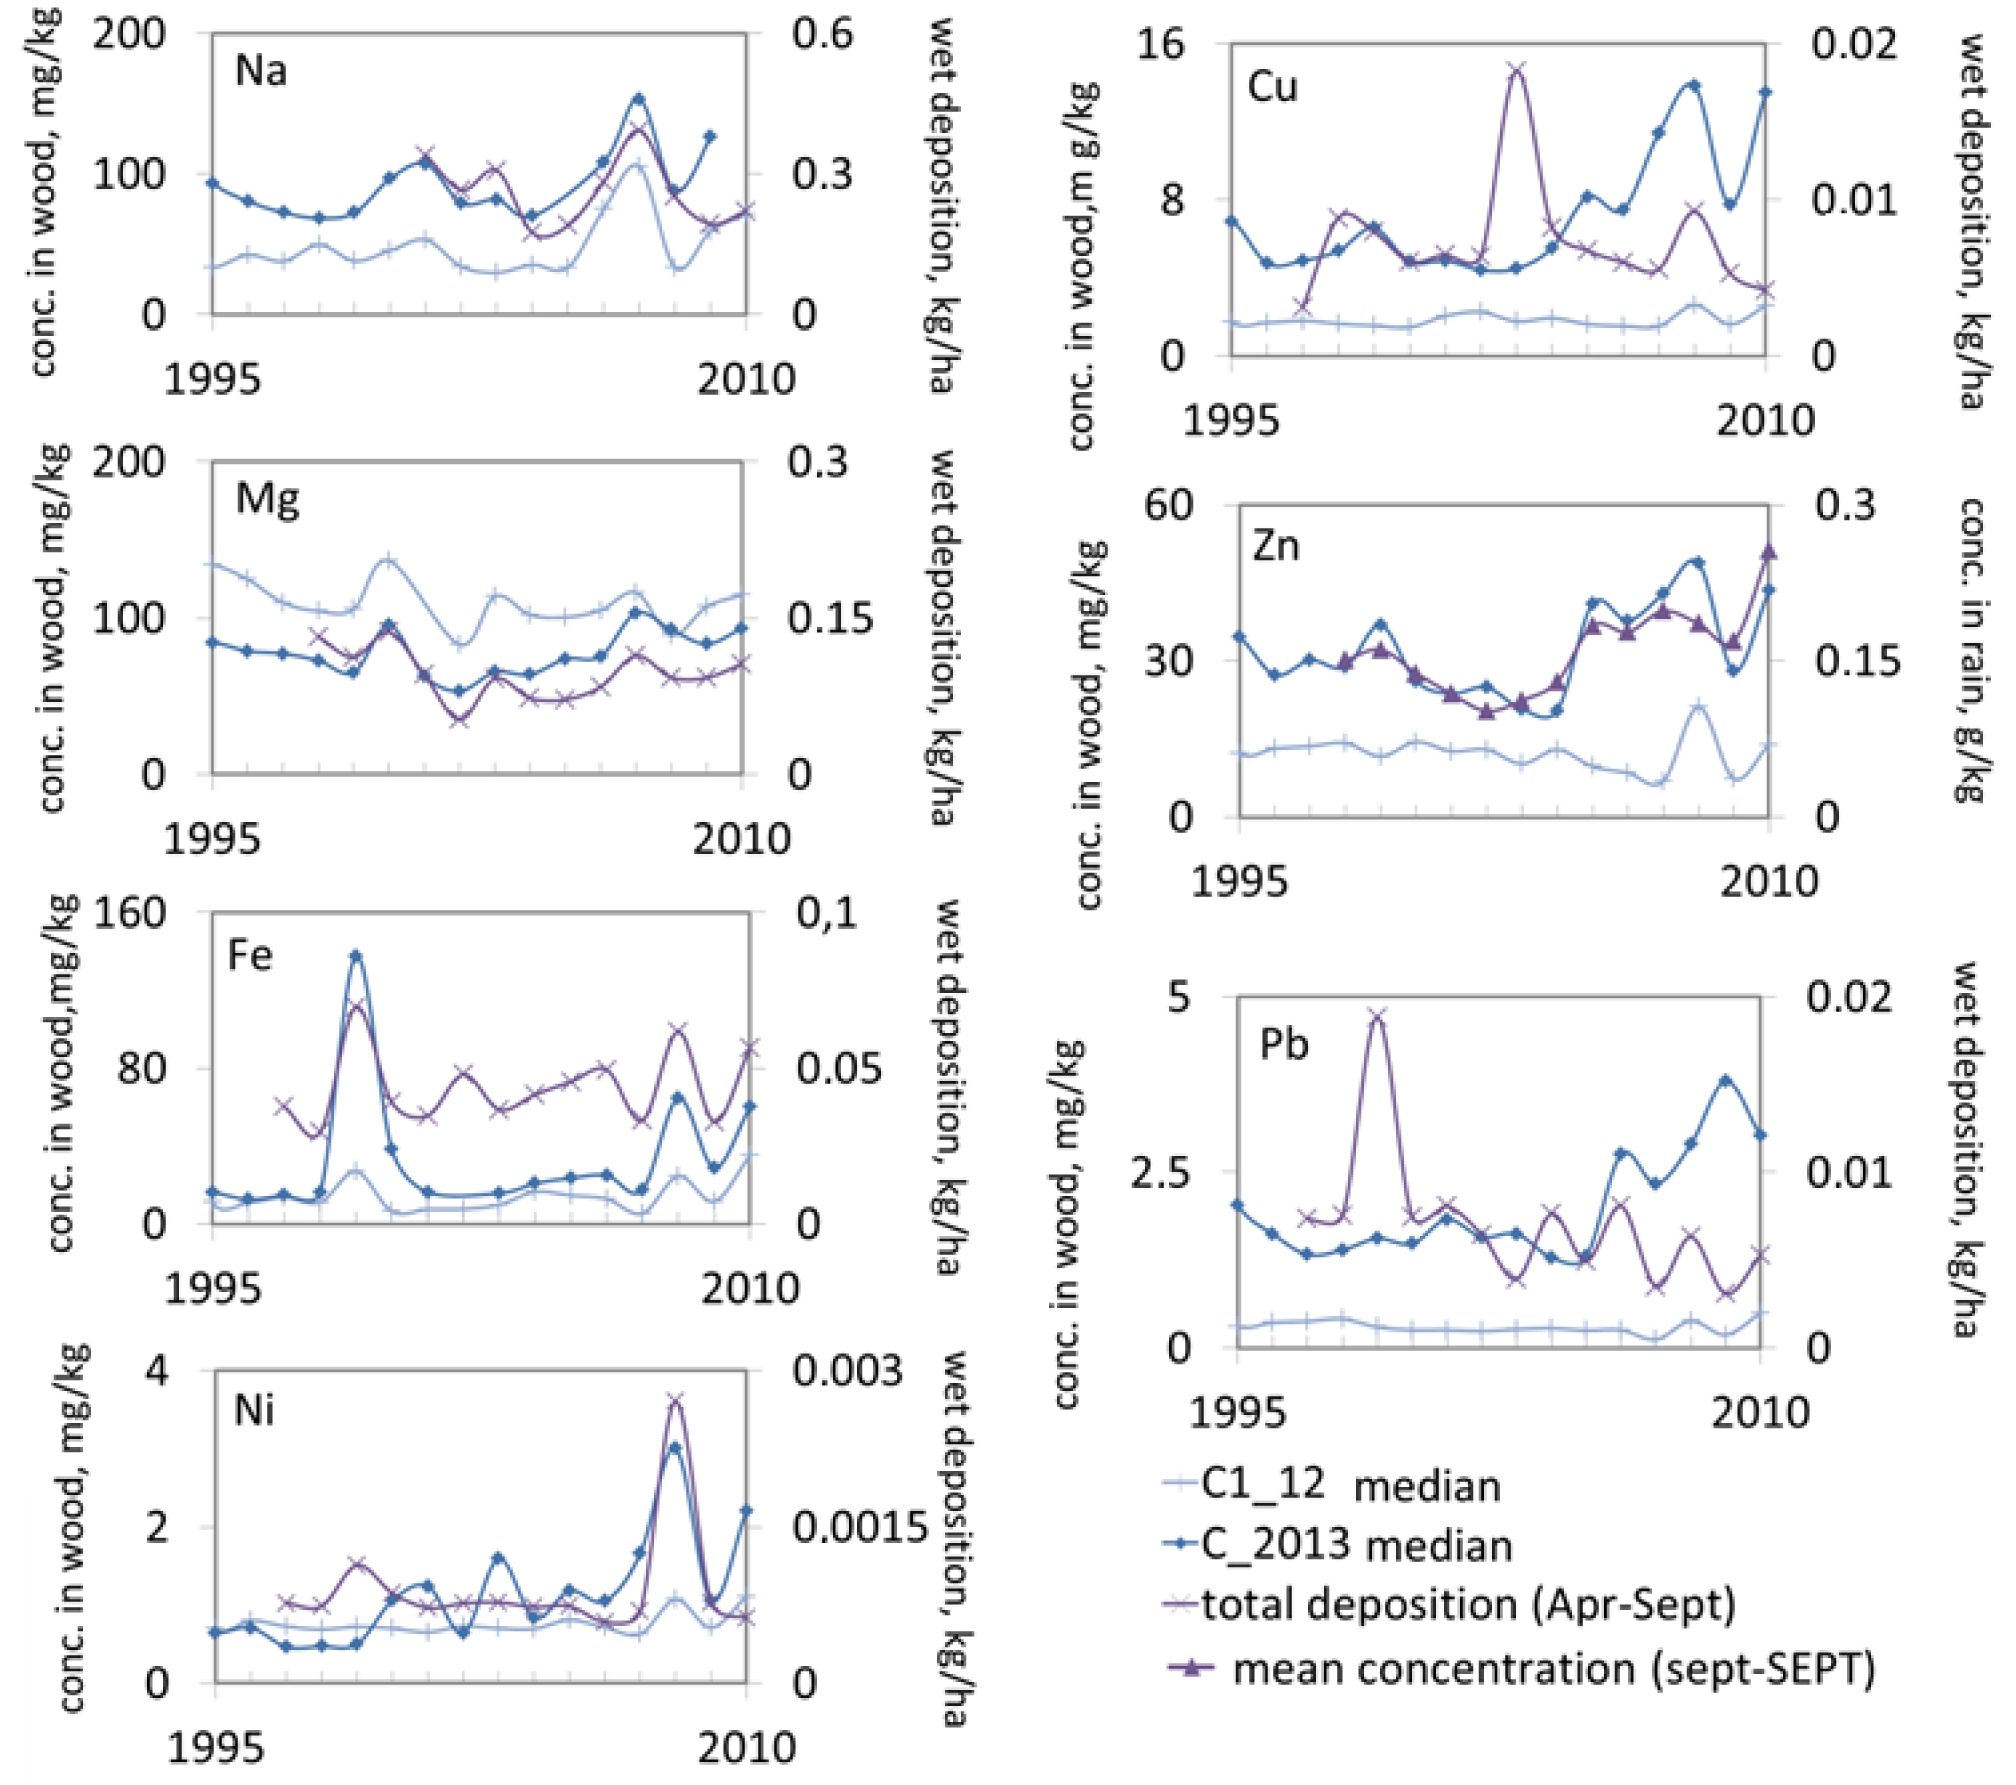
The similar trends of magnitudes (Fig. 7) changes can be observed between analysed elements concentration (Na, Mg, Fe, Ni, Zn) and total wet deposition of these elements in the environment during vegetation period or these elements concentration in the rain. The vegetation period begins in Poland at the end of March or beginning of April and finishes in September. Despite the fact, that there was no similar trends between Zn concentration in analysed wood and total wet deposition of Zn during vegetation period, it is observed that Zn concentration in wood is highly correlated with mean concentration of Zn in the rain since September of previous year to September of current year. The environmental conditions in which tree had growth in the previous year have influence on the tree rings created in given year.
Chemical wood composition data shows some large peaks in wood profile. The difference between the elements record of tree rings and elements deposition or concentration in the air is that the former represents yearly averages whilst the latter are single-day measurements. During a day concentration of some elements can change by 300% (Statistical Yearbooks of the Environmental Protection 1975–2012).
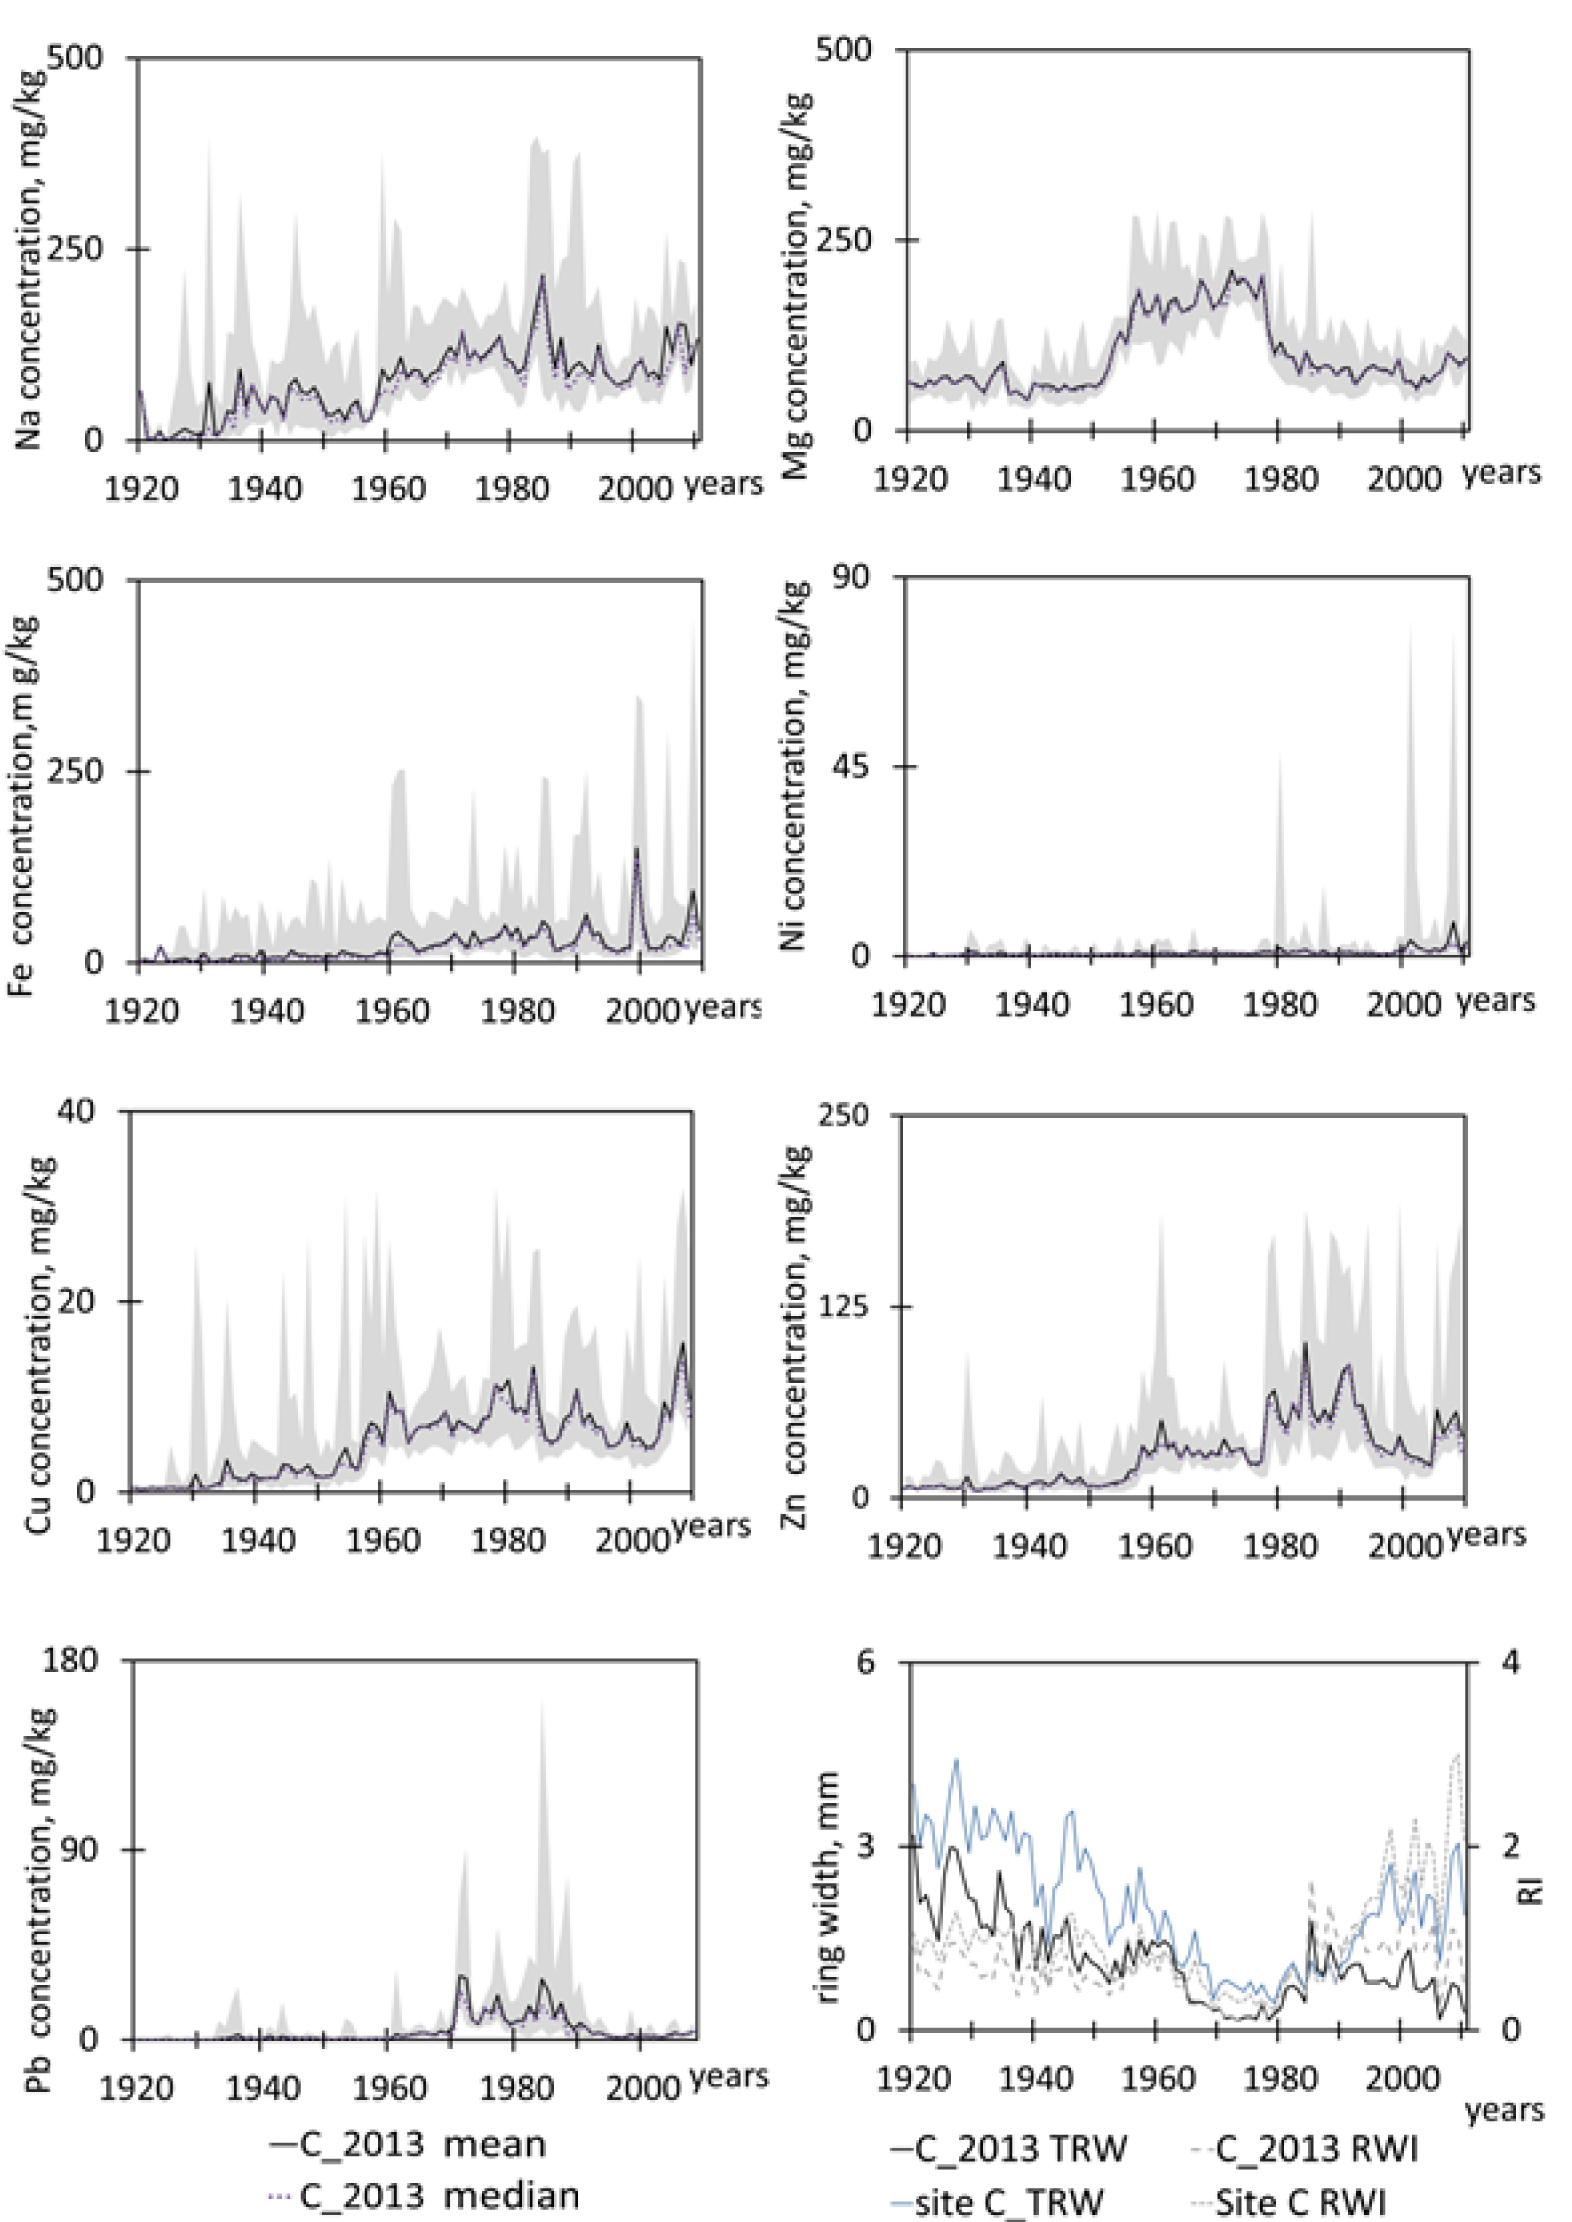
Pine had very low elemental concentrations in heart-wood and higher concentrations of analyzed elements in sapwood (since 1950s). Na, Fe, Cu, Zn have shown increasing gradient (Fig. 8), especially since 1960s up to now, whereas Mg increase in the period of time since 1960s till 1980s and then Mg decrease. Mg is known as the element of high mobility. It has been observed significant increase of air pollution in this period of time (1960s–1980s). High Pb concentration was observed since 1970s till 1990s, when lead compounds were added to gasoline for their antiknock properties. Using of - unleaded gasoline reduced Pb concentrations over the following years. Further work is needed on the possible migration of elements between tree rings in these tree species. In this stage, a particular year of environmental change could not be pinpointed down to the individual year.
. Discussion
The determination of properties of tree-rings is crucial for many applications in the investigation of local and global environmental changes. Since the beginning of the 20th century, there has been much discussion about how external environmental factors, including anthropogenic effects, affect the physiological processes that control tree growth. In the last few decades, many scientists have studied spatio-temporal distribution of pollution by conducting a chemical wood composition analysis of different species to establish the impact of soil, air and water contamination.
Dendrochronological analysis
The year-to-year variability of tree ring qualities is shaped largely by the climatic factor (Fritts,1976; Sensuła and Wilczyński, 2017). However, industrial pollution affects medium- and long-term changes in the incremental characteristics. This depends on the degree and time of the pollution, tree species, habitat conditions, orography of the area and the location of trees in relation to emitters (Wilczynski, 2006; Malik et al., 2012; Sensuła et al., 2015a, 2015b). Often sub-populations located along transects relative to the emitters are chosen. In this way, one may get information about a spatial differentiation of the pollution-growth relationship (Krąpiec and Szychowska-Krąpiec, 2001; Danek, 2007; Malik et al., 2012). Populations of trees on a large area are also researched together (Elling et al., 2009). The changes in the size of the radial growth are analysed most often. The size of the ring is treated as a measure of vitality of the trees and their incremental potential (Swetnam and Lynch, 1993; Pedersen, 1998; Krause et al., 2003). In the absence of information about immisions, data on emissions of various pollutants are used (Krąpiec and Szychowska-Krąpiec, 2001; Wilczyński, 2006; Danek, 2007; Elling et al., 2009; Malik et al., 2012).
The 1960s, 70s and 80s are a period of rapid growth of industrial production, which resulted in an increase in the emission of pollutants. The incremental changes in the reactions of Scots Pine which we have observed can be attributed to the impact of pollutants. In the years 1960–1990 there was a decline in the thickness growth of pines. At the same time, the uniformity of incremental reactions and sensitivity to short-term environmental impulses decreased. These developments, however, show a distinct spatial variability which results from the locations of sites in relation to the emitters and the direction of the prevailing winds. Site S was located on the side of industrial factories and away from the zone of the prevailing winds. Pines growing there showed no reduction in growth or decrease in sensitivity. On the N site reductions were very insignificant. This population was located far away from both ZAK factory and also outside the main zone of migration of pollutants from Blachownia company. Therefore the position of trees relative to the emitters and direction of winds that carry pollution is significant.
Pine belongs to a species which is susceptible to industrial pollution. Such pollution reduces the radial growth of pines. Increasing the heterogeneity in incremental response of pine trees also occurs (Wilczyński, 2006). The trees which we have we examined have a high vitality, produce large growth rings and show a high sensitivity to short-term impulses and high uniformity of incremental reactions. They have survived three difficult decades. These were the strongest specimens which in their radial increments have recorded information about the biological effects of pollution. Weaker trees were systematically removed from the population and this information has been lost.
Chemical wood composition
Many elements (P, K, Ca, Mg, Fe, Na, Zn, Cu, Mo, Co, V) are essential elements to living organisms, but their excessive amounts are generally harmful to plants, animals and humans (El-Hasan et al., 2002).
Scientific literature reviews shown that different elements are important in physiological functions of plants, and that the air pollution and soil contamination may be toxic to the trees. The degree of air pollution is associated with the amount and type of the substance in the atmosphere. Trace elements are removed from the atmosphere by wet and dry deposition, diffusion and retention on solid surfaces. As a consequence of atmospheric pollution, trace elements accumulate in forest ecosystems. Each of the pollutants studied here had some effect on the concentration of biochemical compounds in pines. The scientific literature reviews shown, that trees have been used to monitor heavy metal pollution (Pearson et al.,2006; Danesino, 2009; Leonelli et al., 2011) Some studies shown, that trees may not provide reliable information at the yearly scale on past variations in contaminated soils and a key role for absorption of elements is played also by soil acidity. But, on the other hand the scientific literature reviews shown that tree rings yearly formed in wood are a wide and complex source of data, potentially offering hints on the impact of atmospheric pollution. They can provide material for dating events at a high temporal resolution, i.e. yearly or seasonally. In addition, given their broad spatial distribution, trees offer possibilities of correlations over vast territories (Pearson et al., 2006; Danesino, 2009).
The existence of chemical factories near the investigated sites may be related to the rather high levels of investigated elements concentrations in the wood, especially in the period of time between 1960s and 1980s. This higher concentration of elements linked also to the change in tree-ring width. Also the narrowest tree rings has been linked to the increase of air pollution emission. Dmuchowski and Bytnerowicz (2009) reported that very high levels of pollution and serious ecological effects occurred near the emission sources. The analysis of trace elements in the samples of soil in the areas situated close to the factories (Kusza et al., 2009) showed an increase in the content of lead (Pb), zinc (Zn) and cadmium (Cd).
Natural and anthropogenic sources (Cutter and Guyette, 1993) may contribute to accumulation of metals in the ecosystem where trees grown. Most of the trace elements (Cd, Cr, Cu, Fe, Mn, Ni, Pb, Zn) are derived from mining, metal smelting, coal and petroleum combustion, oil burning, incineration of waste, cement production and other industrial activities (Magnavita, 1989; Lombardo et al., 2001).
It has been observed that vegetation intercepts the aerosol and the concentrations of elements are high in samples of plants from industrial areas. The addition of lead to the Earth’s ecosystem has long been recognized on a global scale (Shotyk and Le Roux, 2005). Over the last decades the increased awareness of environmental issues had led to the recognition that anthropogenic Pb emission to the environment represents a serious health hazard because of toxicity of this metal (Tommasini et al., 2000). The tree rings can be a powerful biogeochemical tracer for monitoring heavy metals of urban area (Tommasini et al., 2000). According to Tommasini et al., (2000) tree rings can possibly record a time-integrated industrial Pb emission and also Cd, Zn and Ni could be find in petrol and motor oil; therefore, motor vehicles could be an important source of these contaminants. It is likely that urbanization and high traffic are the major reasons for high concentrations of these metals (Lombardo et al., 2001). According to Siklosy et al., (2011) the dendrochronologically derived date of tree rings characterized by elevated Mg and Zn levels matches the most intense industrialized period.Different groups of elements in terms of availability for plants and the risk of contamination of the food chain, using the theory of soil — plant barrier, have been distinguished (Chaney and Oliver, 1996): (i) elements which are not dissolved in the water, which are collected in small quantities (Cr) (ii) elements quite easily collected by the roots but transported in small quantities to the aerial parts (Pb), (iii) elements which are readily taken up by the roots and transported to the aerial parts, however, reduce the risk of phytotoxicity to the feed chain (toxic to plants and the original contents and non-toxic for humans and animals) (Zn, Cu, Ni) (iiii) elements which constitute a real risk to the food chain, under certain conditions, can be toxic to humans and animals and non-toxic to plants (Cd).
Trace elements measured in tree components may be used for biomonitoring of air pollution. Whereas, it has been reported that some elements can migrate within trees, example P and K have shown increasing gradient towards the boarded of xylem, whereas Ca decrease towards the inner portion of the xylem. Some other elements (example Zn, Al, Cu) have constant concentration in all parts of xylem (Myre and Camire, 1994).
. Conclusions
The information on the effects of industrial pollution has been recorded by pine trees in short- and long-term incremental response changes — the size of growth in thickness, uniformity of incremental response, sensitivity of trees to short-term environmental impulses and the elemental composition of wood.
The pressure of industrial pollution is revealed in these trees in long-term reduction in the size of thickness growth, reduction in the level of homogeneity of shortterm incremental response and reduced susceptibility of trees to short-term environmental impulses. The reactions of pines after pollution subsided should be considered interesting — pine trees quickly and strongly increased their thickness growth. The homogeneity of their year-to-year incremental response and sensitivity to short-term impulses has also significantly increased. These can be seen as symptoms of regeneration of these trees. It turned out that the degree of regeneration was greatest in populations that have been most affected by pollution. The degree of industrial pollution pressure can be observed after many years in the strongest specimens which had survived this period. This record takes various forms and affects the size of incremental growth and disturbance in the incremental reaction of trees.
Each of the pollutants studied had some effect on the concentration of biochemical compounds in pines and tree ring width. Trees can be indirect indicators of changes in ecosystem, where trees growing in non-controlled field conditions.
The importance of these proxies is highlighted as an important record of environmental contamination in the past, when detailed emission information and possible deposition rates from pollutant sites are not available. The results show that trees can record environmental impacts, and thus preserve environmental pollution signals, and trees can be a source of information that can help in environmental monitoring.
Ring width and elemental composition of tree rings growing in field conditions can be indicative of past pollution effects. Strong industrial activities in Poland provide an opportunity to study the possible environmental effects of chemical factories.