
. Introduction
The INTIMATE protocol for the correlation of marine, ice core and terrestrial records has been developed in the last decades (e.g. Björck et al., 1998; Lowe et al., 2001, 2008; Blockley et al., 2012; Davies et al., 2012). In the frame of the last INTIMATE programme (COST action ES0907) many synthetic papers were born (see e.g. Blockley et al., 2014; Feurdean et al., 2014; Rassmussen et al., 2014; Birks et al., 2015; Gębica et al., 2015; Kiss et al., 2015; Starkel et al., 2015).
Central-Eastern Europe is located in a transitional zone from oceanic to continental climate, where during the cold stages of the Quaternary the expansion of continentality was westward. During the last cold stage this part of Europe was invaded twice by the Scandinavian ice sheet that made the boreal forest recede towards the South-East in relation to continental permafrost expansion to the West. The simultaneous expansion of steppes from the Pontian area to the Carpatho-Dinaric region (with intramountain basins) resulted in the formation of vertical zonality, characteristic also for contemporaneous central Asian mountains with the upper tree line controlled by temperature (July temp. +10°C), and the lower tree-line controlled by humidity (Grichuk, 1973; Bottema, 1979; Starkel, 1977; Kowalkowski and Starkel, 1984).
For most of the last cold stage Central Europe was occupied by discontinuous permafrost, so a summer active layer was dependent on local conditions, like a type of soil, exposition of slopes and mezorelief.
The authors decided to review the earlier studies, including the sites surveyed in the years 1960–1980. The interpretation of the environment and climate change recorded in those sites previously encountered difficulties.
The task of this paper is to draw attention to the changes registered in various sediments and phenomena such as: vegetation, permafrost, fluvial deposits and forms, colluvia and other records from the Interpleniglacial phase lasting about 25–30 ka. The authors try to compare these phenomena (mainly discontinuous or seasonal permafrost) in South-Eastern Poland, which is a part of Central-Eastern Europe to the present-day conditions, and to the processes transforming geoecosystems of continental NE Asia as Mongolia or southernmost Siberia (Baulin et al., 1984; Vandenberghe et al., 2014) as well as to discuss them against the changes of δ18O in the ice core from Greenland, as it is recommended by the INTIMATE protocol.
All presented in the paper 14C dates were calibrated using OxCal programme (Bronk Ramsey, 2009) and IntCal13 calibration curve (Reimer et al., 2013).
. Probable climate changes during interpleniglacial in Southern Poland in the light of Greenland ice core records
A great number of studies document good correlations of main phases of climate changes registered in diverse continental records from mountain glaciers, lakes, peat bogs, river valley s etc. (e.g. Marks et al., 2015). The NGRIP δ18O curve also allows the following phases to be distinguished (Fig. 1):
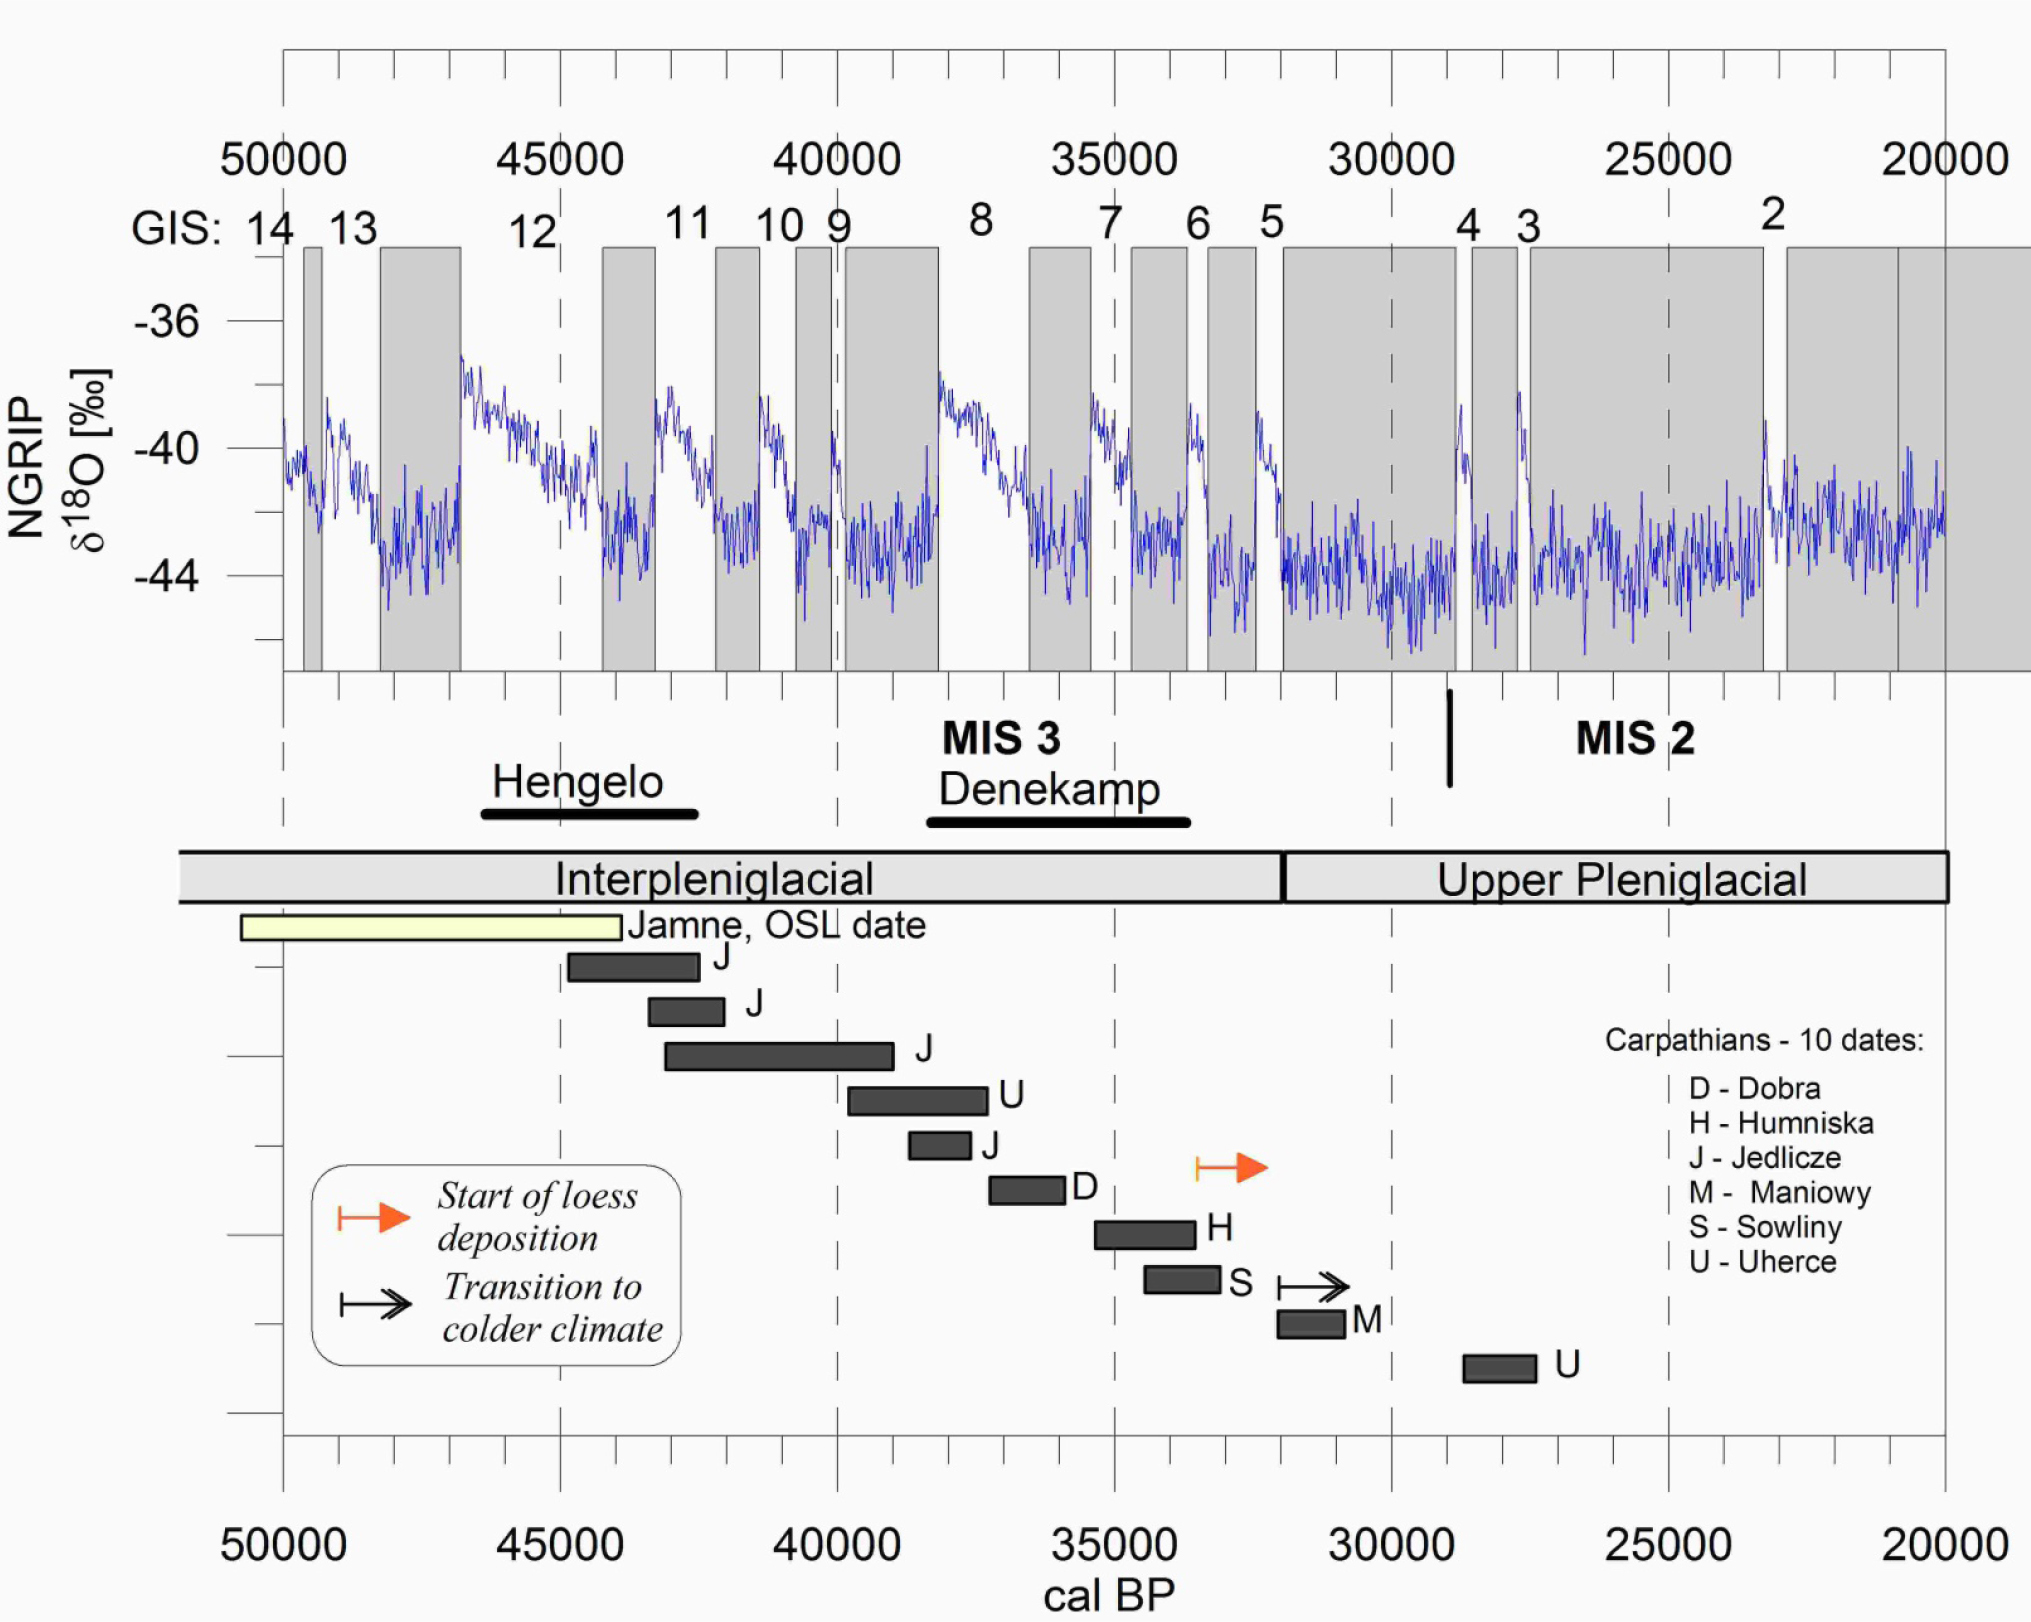
Fig. 1
δ18O of NGRIP profile from Greenland with numbered Greenland Interstadials (after Rasmussen et al., 2014). The stratigraphy of the last Pleistocene glacial stage in Poland is also marked (after Marks et al., 2015), Marine Isotope Stages (MIS) (after Lisiecki and Raymo, 2005) and average timing of interstadials refered to as Hengelo and Denekamp (different authors).
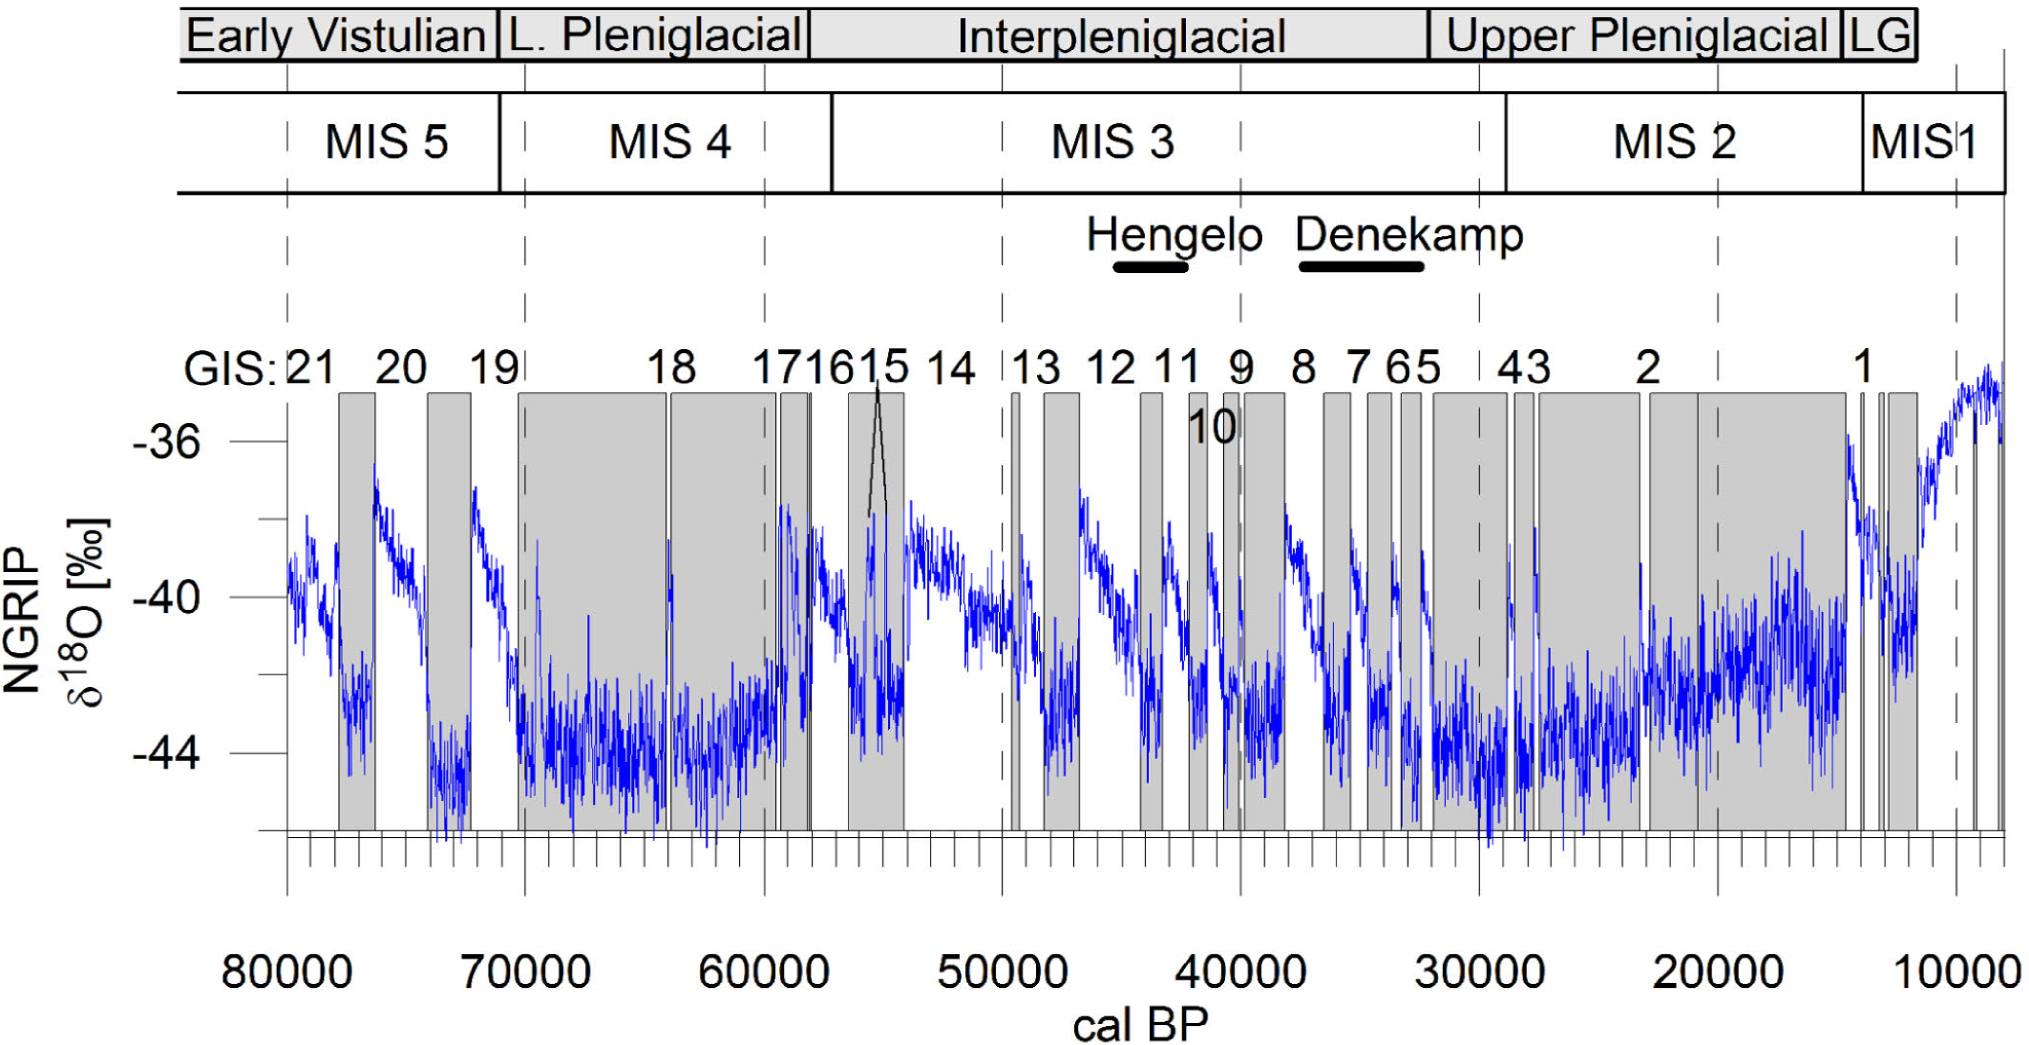
- long Early Vistulian (110–71 ka BP, marine stages 5a–5d) with three-four distinct interstadial warmings;
- Lower Pleniglacial (71–58 ka BP, stage 4) with warmings at the beginning and at its end;
- Interpleniglacial (58–32 ka BP, stage 3) with about 10 warmings and similar number of coolings (each phase 0.5–3 ka long);
- Upper Pleniglacial (32–14.8 ka BP, stage 2);
- Late Glacial (14.8–11.7 ka BP).
A characteristic feature of every short cycle during the Interpleniglacial was its duration of 1–4 ka, and a rather great amplitude of changes in temperature (4–6‰ δ18O) with gradual coolings and rapid warmings. Altogether, in the Vistulian, we find two relatively monotonous cold phases (stages 2 and 4) with ice sheet cover and permafrost, which together lasted only approx. 30% of the entire cold stage. This means that the remaining two thirds of the Vistulian were occupied by the “transitional” climatic phases with either expansions or retreats of permafrost, as well as with continual transformation or adaptation to new conditions of hydrological regime, vegetation etc.
The question arises: what do we mainly want to reconstruct from the past? Do we only want to reveal the extreme situation based on permafrost phenomena preserved in various sediment facies? Or do we try to follow how pollen spectra, lithology of slope and fluvial systems etc. have been changing during long phases of transformation (being sometimes delayed in relation to climatic changes). This continuous adaptation to the undergoing changes should be well expressed, for instance, in the climbing or descending of the upper tree-line as well as in the expanding or retreating of permafrost, and finally should be reflected in the slope and fluvial deposits, which unfortunately have many gaps.
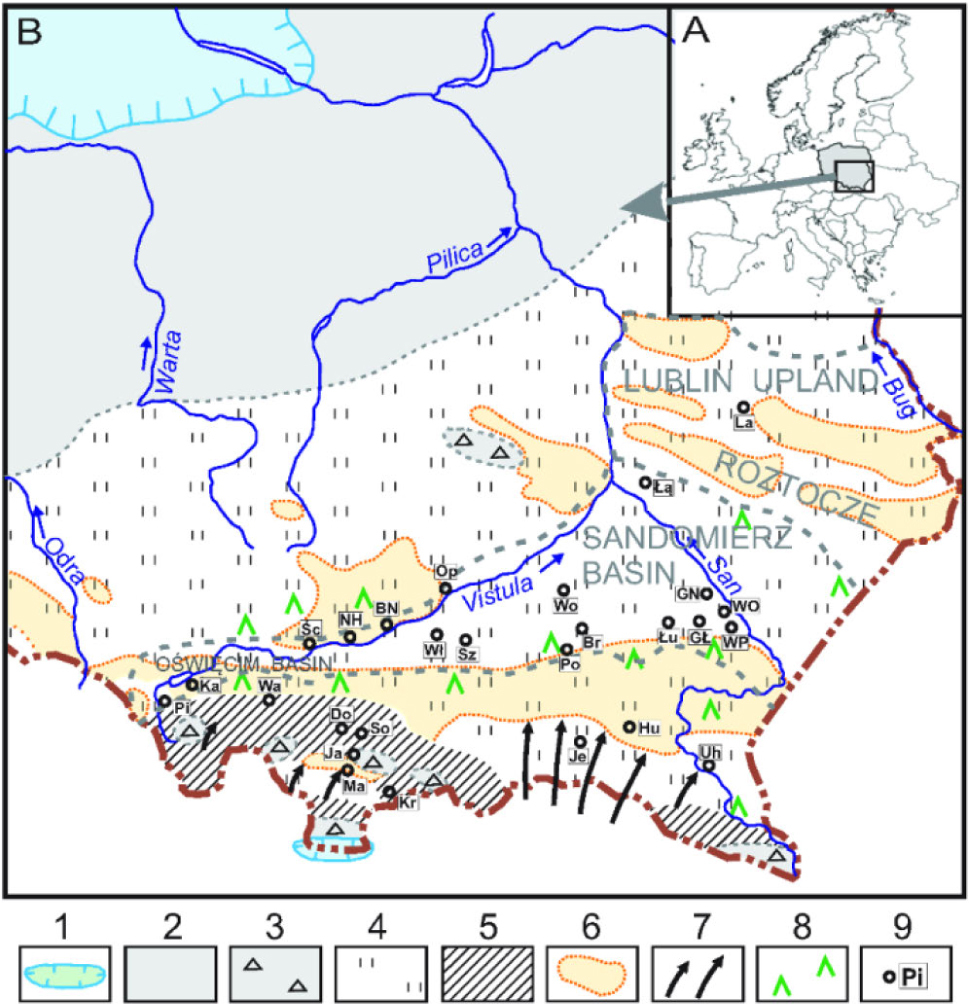
Let us characterise the changes in three regions of Poland, starting from South to North (Fig. 2), i. e. localities dated by 14C and s ometimes by a luminescence method.
Fig. 2
A — map of Europe with Poland and the investigated area marked (rectangle). B — Palaogeography of the Carpathians and its foreland during the Pleniglacial (after Starkel, 1988): 1 – glaciated area, 2 – arctic desert, 3 – debris covers and active cryoplanation, 4 – tundra-steppe vegetation, 5 – intensive solifluction (areas with higher precipitations), 6 – areas of loess deposition, 7 – directions of intensive deflation, 8 – areas of probable preservation of some tree species, 9 – sites discussed in the present paper: Carpathians: Do – Dobra, Hu – Humniska, Ja – Jamne, Je – Jedlicze, Kr – Krościenko, Ma – Maniowy, So – Sowliny, Uh – Uherce, Wa – Wadowice; Oswiecim Basin: Ka – Kaniów, Pi – Pierściec, Śc – Ściejowice; Vistula and Lower Dunajec valleys: BN – Brzesko Nowe, NH – Nowa Huta, Op – Opatowiec, Sz – Szujec, Wł – Włoszyn; Wisłoka valley: Br – Brzeźnica, Po – Podgrodzie, Wo – Wojsław; Wisłok and San Valleys: GŁ – Główczyna Łańcucka, GN – Grodzisko Nowe, Łą – Łążek, Łu – Łukawiec, WO – Wólka Ogryzkowa, WP – Wólka Pełkińska; Lublin Upland and Roztocze: La – Latyczów.
Sequence of changes in sediments and forms in the Carpathians
The longest break in expansion of permafrost was during stage 3 (the Interpleniglacial 58–32 ka BP), when the short coolings were alternated with about 10 warmings (cf. δ18O curve from NGRIP). The expansion of the boreal forest to higher elevations took place at least during 3–4 distinct interstadials (Środoń, 1968; Feurdean et al., 2014). At Wadowice (300 m a.s.l., Fig. 3), among the colluvia and deluvia of an entire Pleniglacial, a rocky landslide was confirmed, which indicates the melting of the permafrost and the recovery of groundwater circulation (Sobolewska et al., 1964). The decalcification of sandstone debris in a middle horizon of the colluvia at Zabrodzie to a depth of 3–4 m (360 m a.s.l.) indicates the dominance of leaching under a relatively temperate climate (Dziewański and Starkel, 1967). Unfortunately, for both the localities, described in the 1960’s, 14C and luminescence datings are missing. Only the silty-sandy fill of the palaeomeander at Uherce with a tundra-forest pollen spectrum, 15 km downstream from Zabrodzie, (Starkel et al., 1999) was dated. For several meters of this fill we have five 14C dates which fluctuate between 34100 ± 900 BP (Gd-10356, 39800–37300 cal BP) and 23850 ± 700 BP (Gd-9674, 28700–27400 cal BP); unfortunately with an unexplained inversion of the dates (Fig. 5).
Fig. 3
Fluvial and slope deposits from the last cold stage at Wadowice: 1. bedrock, 2. loess, 3. deluvial loams, 4. soliflucion loams (clayly) with debris, 5. as above – sandy, 6. talus debris, 7. peat from Br⊘rup (series d), 8. fluvial sands, 9. fluvial gravels, 10. rocky landslide from Interpleniglacial (series h), (after Starkel [In:] Sobolewska et al., 1964).
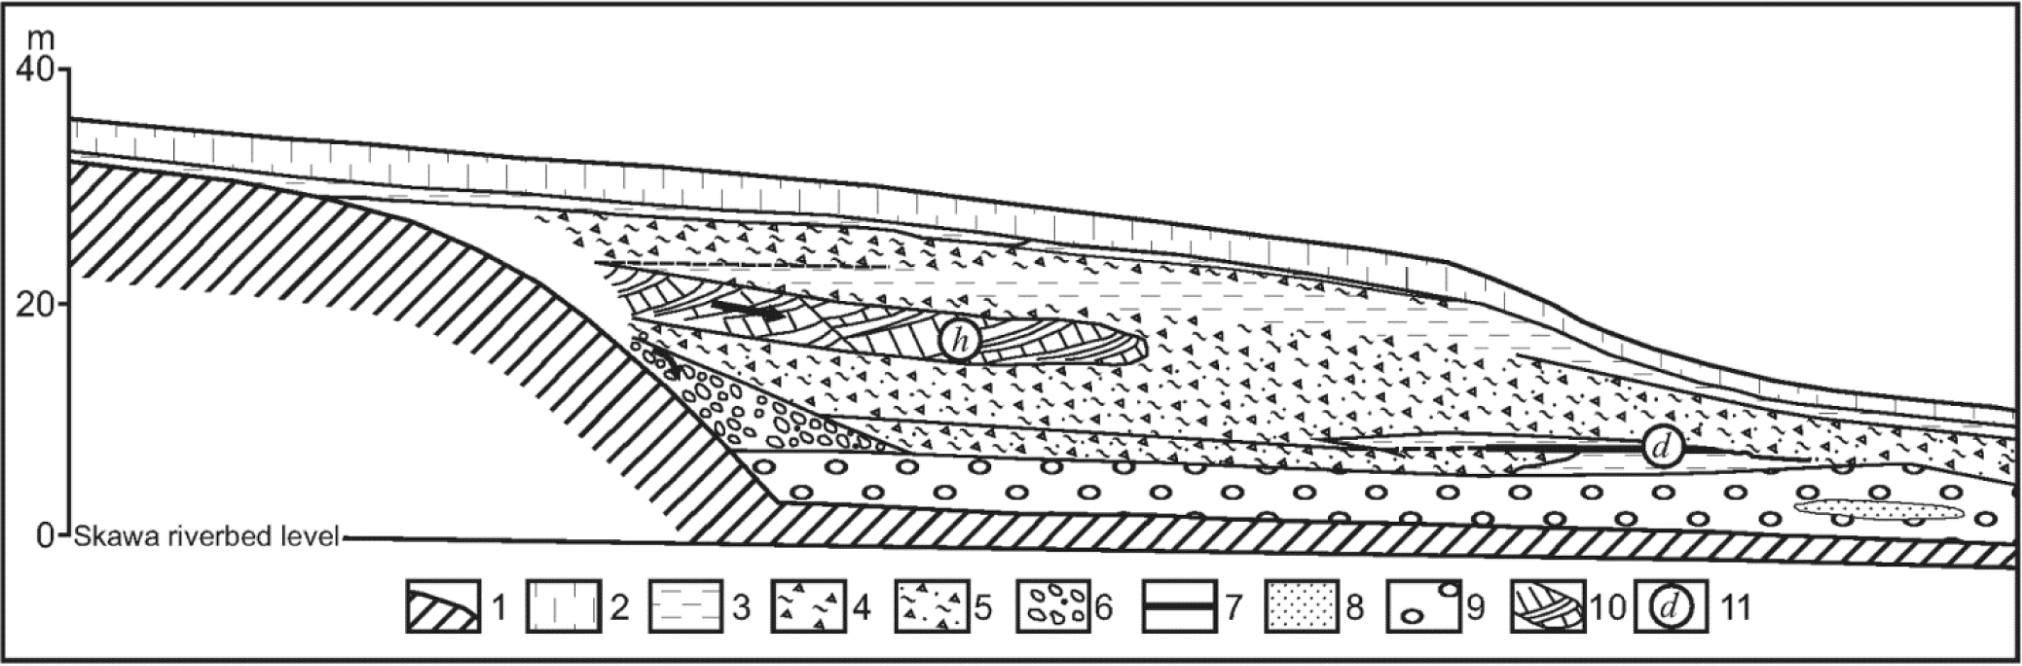
Fig. 4
Interpleniglacial slope deposits at Dobra (Klimaszewski, 1971; Środoń, 1968) and Krościenko (Klimaszewski et al., 1939) in Polish flysch Carpathians: 1. fluvial gravels, 2. solifluction with debris, 3. solifluction dominant clay, 4. coarse debris, 5. silt and clay, 6. organic remains, 7. rare organic remains, 8. sediment members, 9. main sediments units, 10. bedrock.
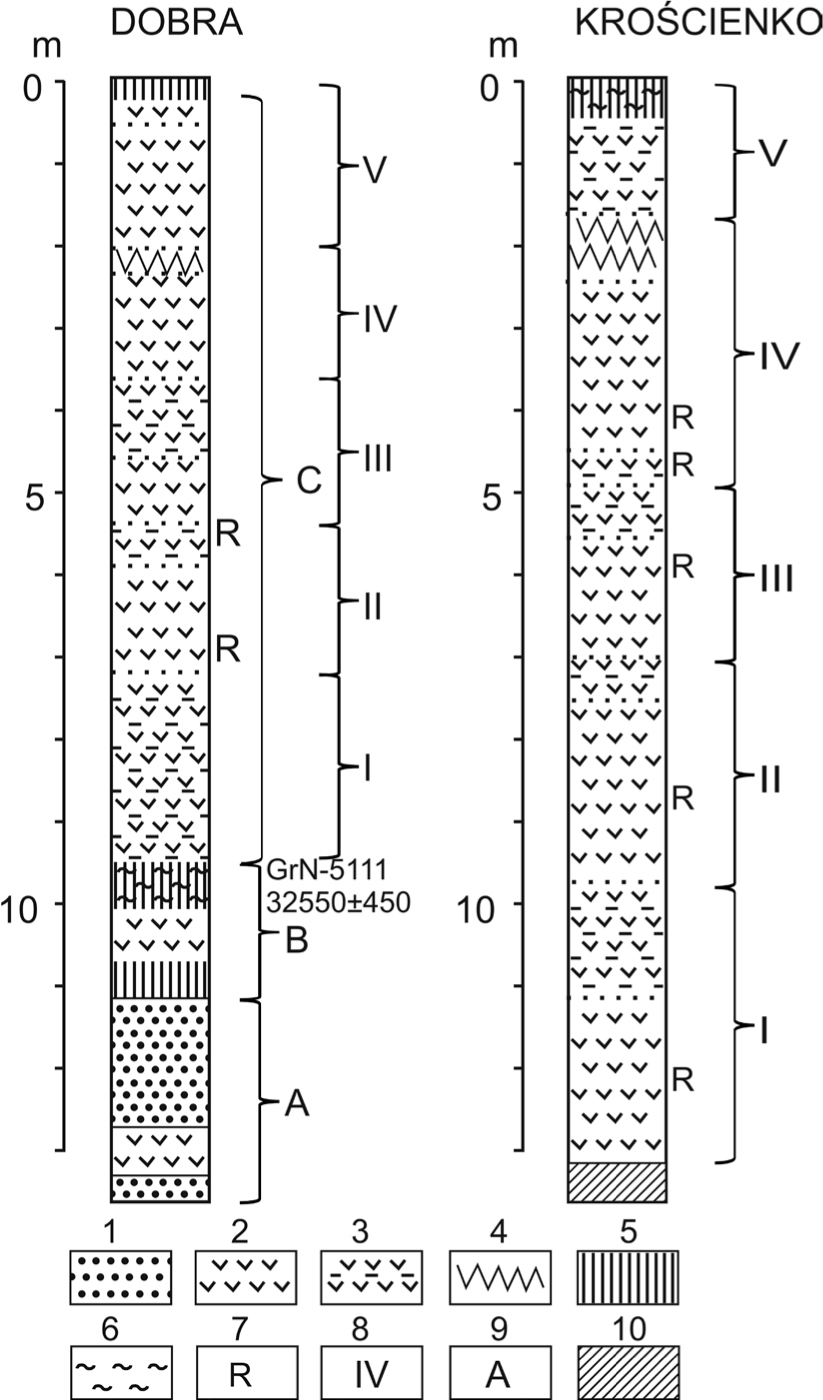
Fig. 5
Selected dates from Carpathians. Calibrated 14C dates from selected localities in Poland are marked by horizontal bars representing intervals of 68.2% confidence.
In the vicinity of Dobra at 470 m a.s.l. (Klimaszewski, 1971; Środoń, 1968 a 10 m thick solifluction complex with a coarse debris filling occurred ), at the base of a long slope,. A 40 cm thick layer of peat with forest–tundra vegetation was found at its base and over the alluvial gravels. The peat was dated at 32550 ± 450 14C BP (GrN-5111, 37250–35900 cal BP) (Fig. 4). It contained not only the pollen of several trees, but also the macrofossils of Pinus cembra, Pinus silvestris, Larix, and Betula alba (Środoń, 1968). Peat is incorporated in colluvia, at which, two other horizons with Pinus pollen appear at higher elevations. Colluvia were supplied from a 500 m higher ridge. It shows a similarity with a “drank forest” now observed in Yakutia. Such thick colluvia seem to be the product of gradual changes of a thick active layer during the late Interpleniglacial rather than of the cold upper Pleniglacial (as supposed by Klimaszewski in 1971) when the active layer was very thin. Between the instant determined by the dated peat and cold stage 2 at least 4–5 short warmings were registered in Greenland (Rasmussen et al., 2014, Fig. 1). A similar, 13 m thick sequence was described from Krościenko (490 m a.s.l.). It included 5 packets of clays, each with debris horizons (Klimaszewski et al., 1939, Fig. 4). This sequence probably also represented several rhythmic fluctuations of temperature and permafrost, characteristic for the Interpleniglacial. A peat layer with tundra vegetation such as: Betula nana, Salix, Hippophae, dated to 29650 ± 650 BP (Gd-1880, 34450–33100 cal BP) (Środoń, 1968), was exposed below a loamy colluvium at Sowliny site, 10 km east of Dobra, in a brick-yard. It coincided with the first cooling after 33 ka cal BP.
A several meter thick colluvia was dated using the OSL method at 47.2 ± 3.5 ka (GdTL-1104, sample collected by L. Starkel) in other valley of the Jamne creek, at the elevation of about 750 m a.s.l., so this also represented the Interpleniglacial. The organic silty horizon dated at 27400 ± 600 BP (Gd-1917, 32050–30850 cal BP) which also dates the transition to the colder climate (Fig. 5) was found in Maniowy in the Nowy Targ Basin (about 500 m a.s.l.), over the Lower Pleniglacial glaciofluvial terrace of the Dunajec river and below slope colluvia. The peat horizon below thick colluvia was dated by 14C method at 36700 ± 2100 BP (Gd-1243, 43200–39000 cal BP; Krysowska-Iwaszkiewicz and Wójcik, 1990), 38700 ± 900 BP (MKL-294, 43400–42050 cal BP), 39800 ± 1380 (Ki-16378, 44850–42500 cal BP) in the Jasiolka valley, at Jedlicze, which coincided with the Hengelo interstadial (Fig. 5). The date of the upper part of peat layer from that locality, 33740 ± 380 (Ki-16375, 38700–37600), seems to correlate with the Denekamp.
Different conditions existed in the wide transversal gate of the Low Beskid Mts. between the Western and Eastern Carpathians where wind played a leading role (Gerlach et al., 1972, Starkel, 1988). The lower part of the silty–sandy loess deposited in Humniska at the northern margin of the mountain Jasło – Sanok Depression was dated using the TL method at >35–30 ka. The silty humic intercalation below the younger loess, dated using the 14C method at 30300 ± 900 BP (Gd-5504, 35350–33550 cal BP) indicates that deposition of the (younger) loess started probably after 33 ka cal BP (Fig. 5). This Carpathian loess is composed of grains blown out from flysch rocks extending in the south. The source of silt grains was confirmed by the identical composition of heavy minerals in the grains and parent rocks (Gerlach et al., 1993). The wind activity dominated during the Upper Pleniglacial cooling with the expansion of permafrost, and the approx. 1 km long and 20–30 m deep deflation basins, that are surrounded by outliers of high terrace with ventifacts (Gerlach, 1990), were eroded in the Jasło–Sanok Depression. The finer younger loess from that period at Humniska has a thickness above 5 m.
The loess was blown out also from the valley floors to the north of a margin of the Carpathian foothills (Łanczont, 1995). What is more, even younger slope covers in the upper San valley had a very high share of the loess fraction (Starkel 1965; Dziewański and Starkel, 1967; Krysowska-Iwaszkiewicz and Wójcik, 1990).
Changes in accumulation in the Subcarpathian Basins
In the Subcarpathian depressions of the Sandomierz and Oświęcim Basins the Vistulian alluvia and, at their margins, loess deposits cover about ⅓ of the entire area. The alluvia build two main terrace niveaus (levels): 15–20 m and 6–12 m above the present river channel (Starkel, 1995a, 1995b; Gębica, 2004; Starkel et al., 2007; Gębica et al., 2015 – see Figs. 6–7).
Fig. 6
A geomorphological map ot the Fore-Carpathian Basins (after Gębica et al., 2015, partly modified). 1 – margin of the Carpathians, 2 – Carpathian foothills, 3 – Uplands, 4 – Fore-Carpathian plateaus, 5 – main escarpments, 6 – Vistulian terraces and alluvial fans, 7 – Holocene valley floors (floodplains), 8 – loess cover on the terraces and plateaus, 9 – fields of drift-sand and dunes (inactive), 10 – geological cross sections, A – Wisfoka valley, B – Oświęcim Basin, C – Vistula and Lower Dunajec valleys, D – Wisfok and San valleys.
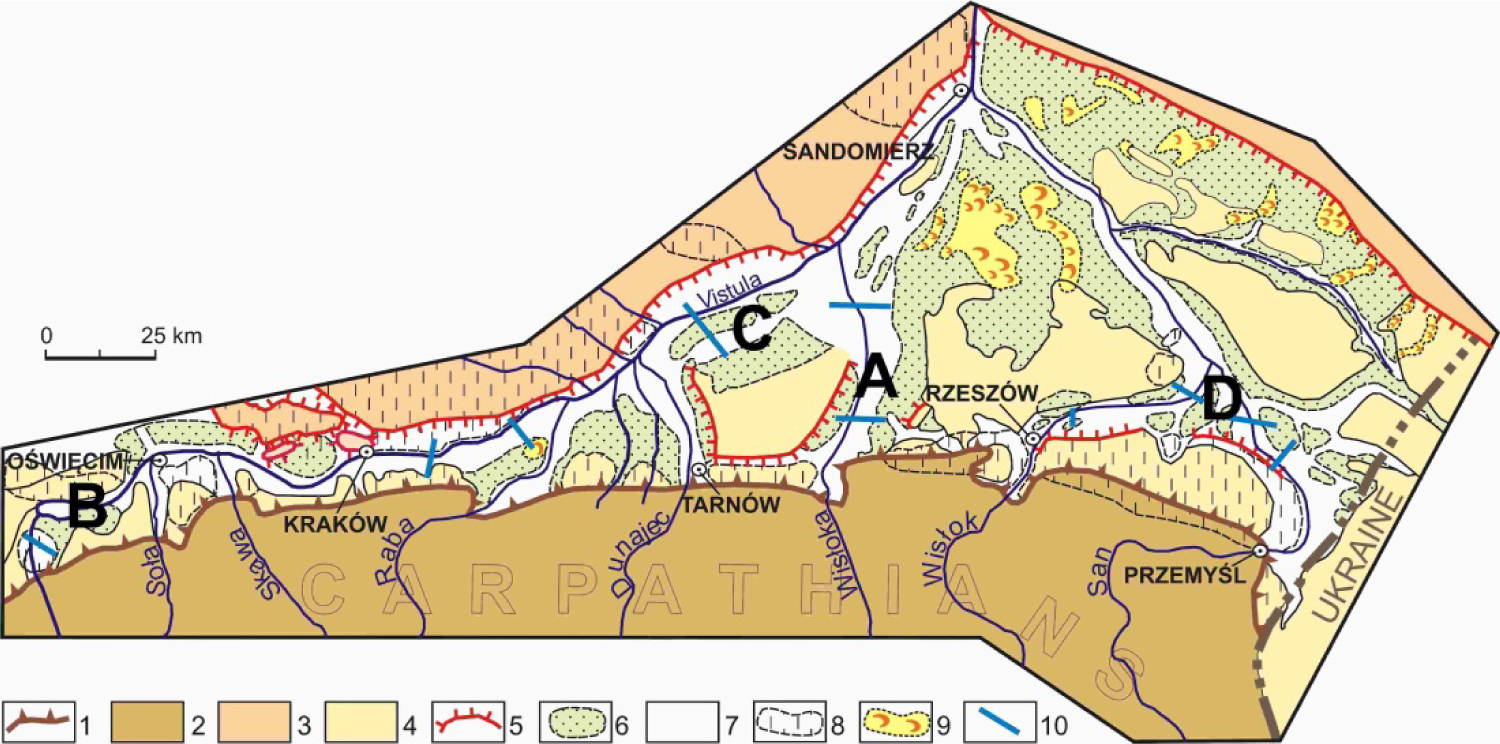
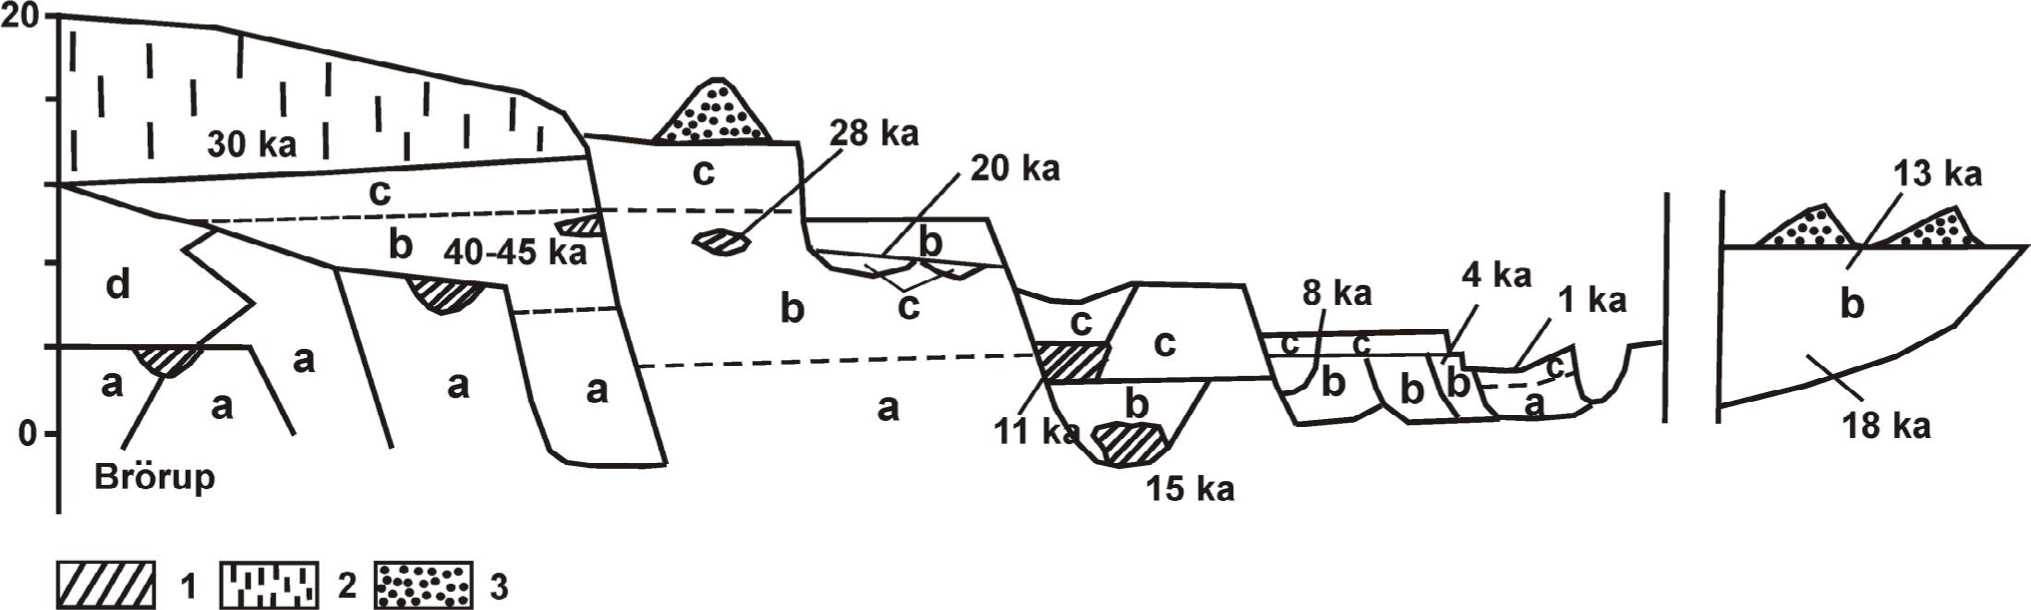
Fig. 7
Synthetic cross-section of valley floors of Carpathian river at their outlet from the Carpathians. a – channel facies of alluvia, older than Interpleniglacial, b – channel facies of alluvia-younger (from Interpleniglacial – to Holocene), c – overbank and palaeochannel fill facies, d – slope colluvia 1 – peat, 2 – loess, 3 – sand dunes.
Wisłoka river valley
The classic sites are located in the central part of the Sandomierz Basin along the Wisłoka river, the tributary of the Vistula river (Fig. 7, Starkel, 1981, 1995a; Gębica, 2004, and others). The higher terrace has the remains of the Early Vistulian or Lower Pleniglacial gravels covered by the Interpleniglacial beds of the palaeochannel fill dated from above 40 ka BP (Brzeźnica, Hv-6868, 41800+ 3850 –2600 BP, 48400–43350 cal BP; Mamakowa and Starkel, 1974) at its base (Figs. 7–8). The lower part of the fillings contains about 50% AP with macrofossils of Larix and Pinus cembra. It was a parkland landscape.
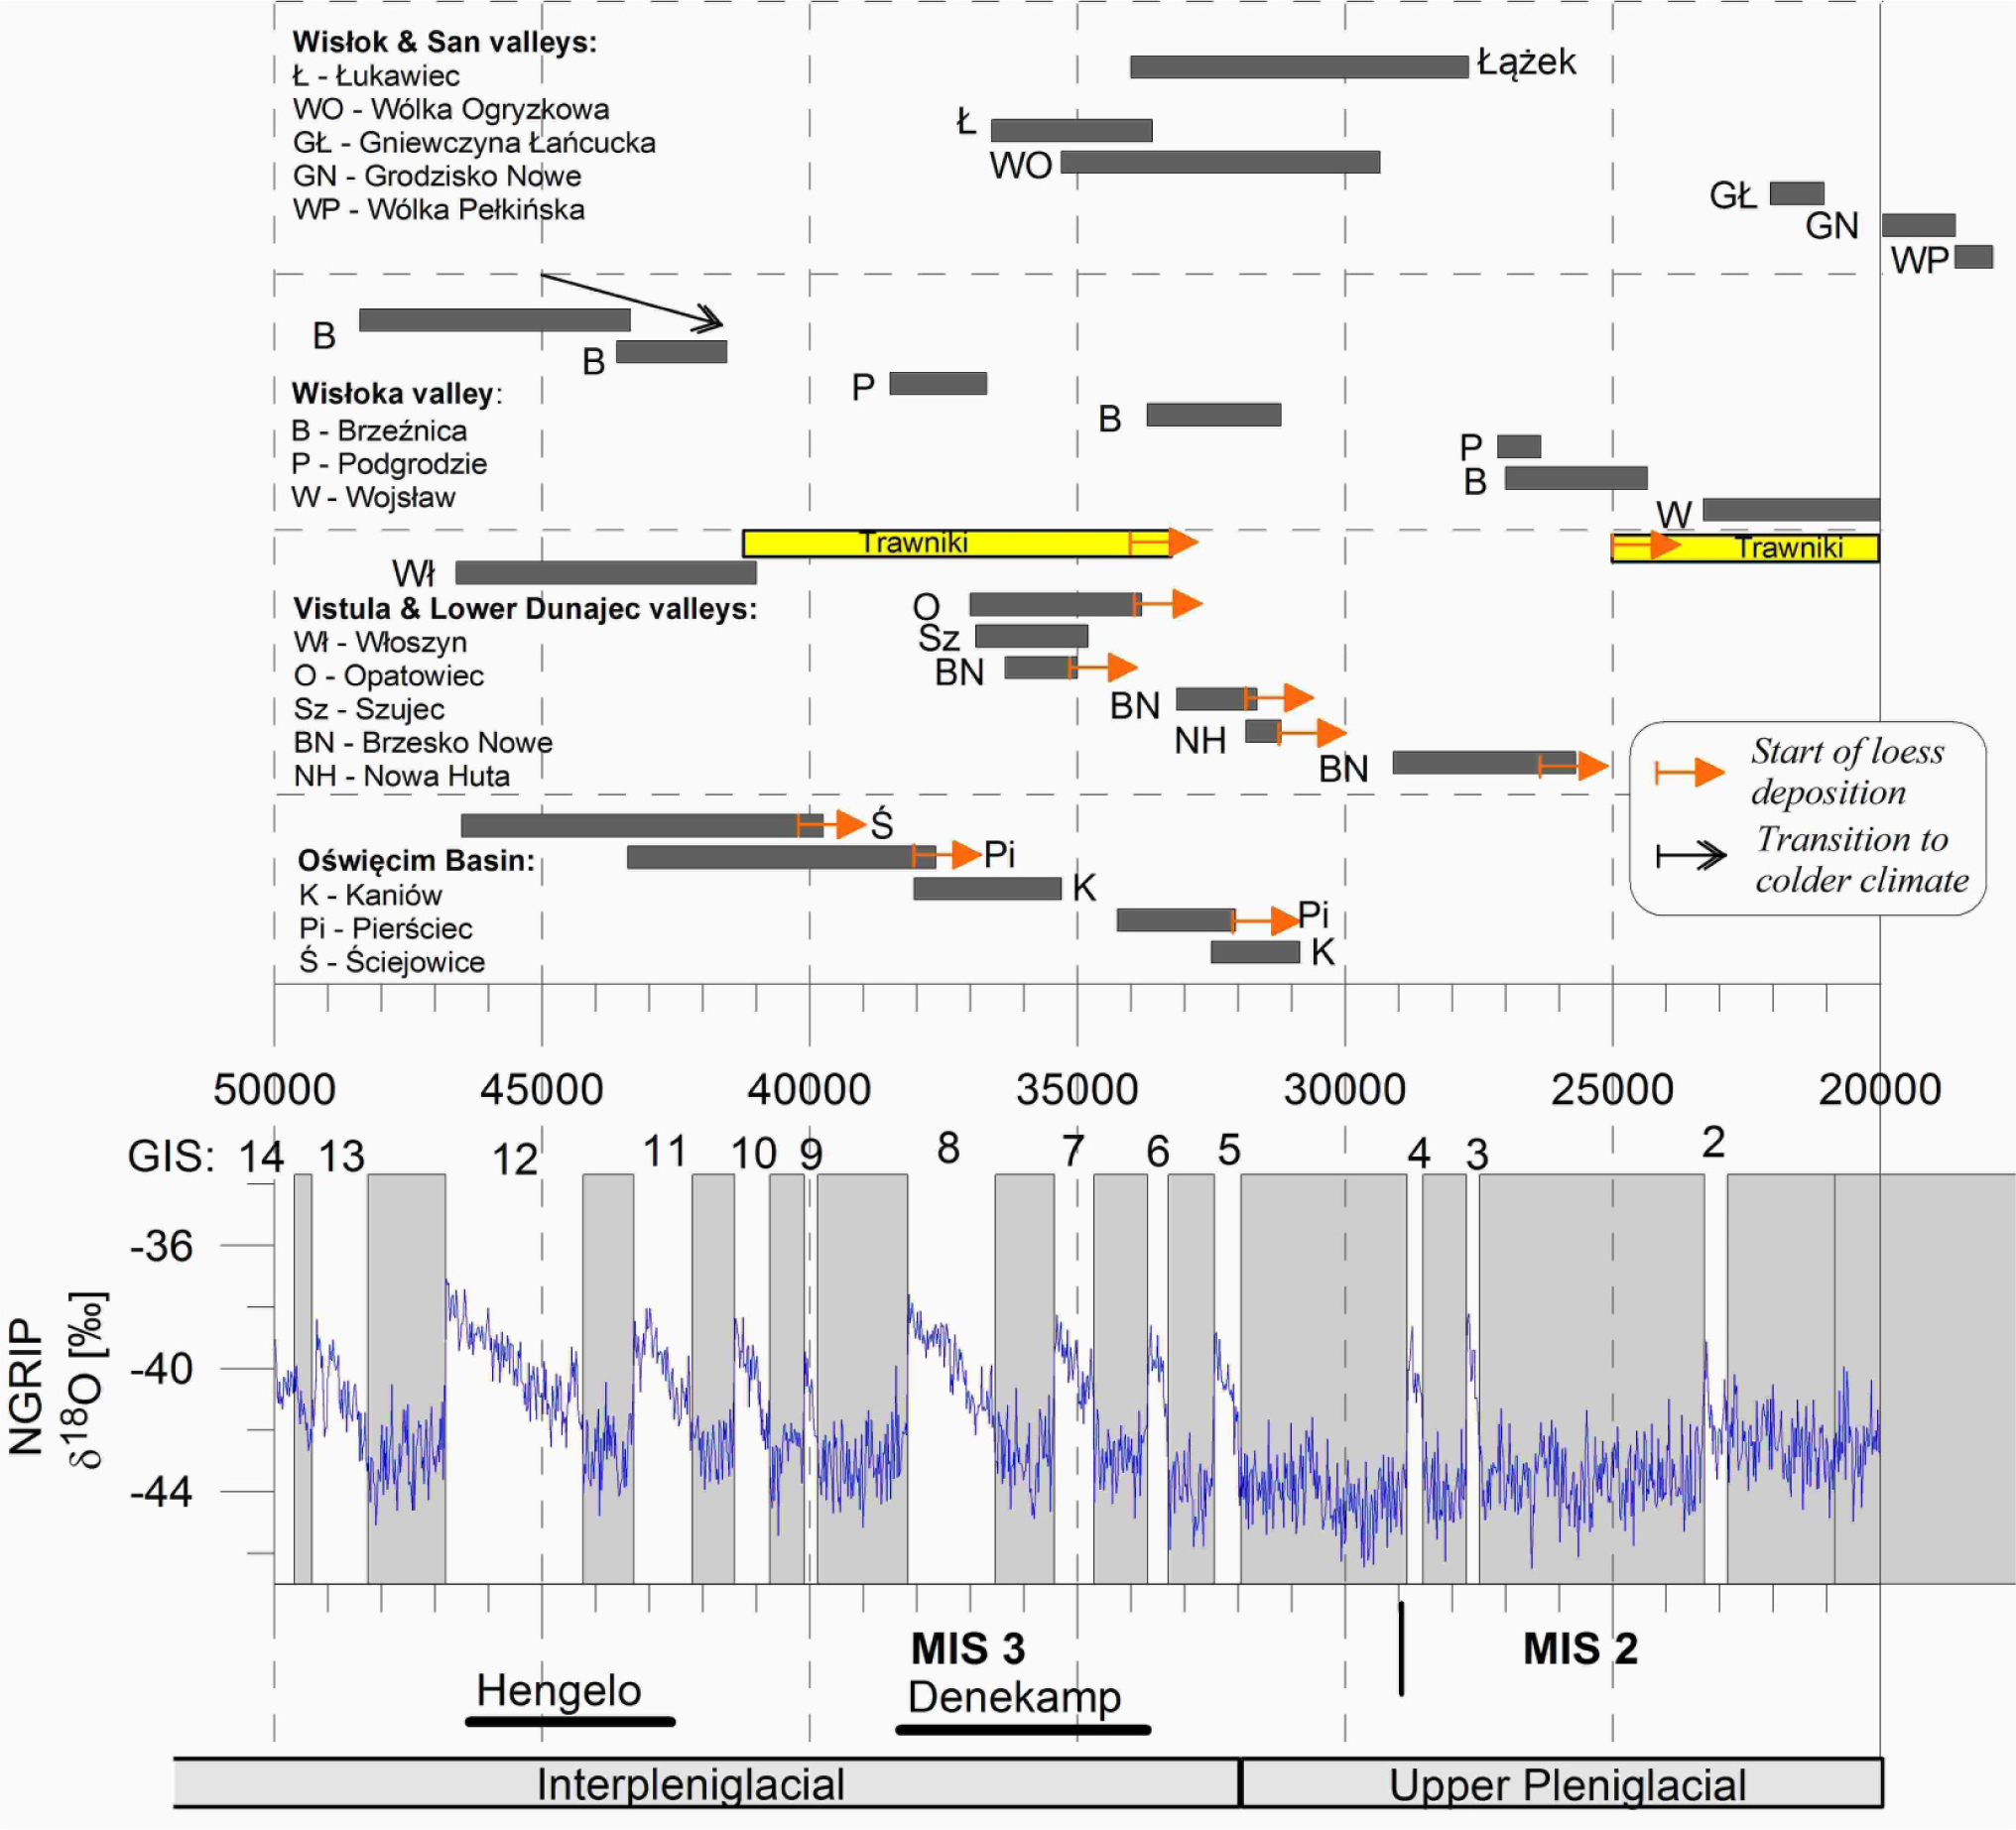
Fig. 8
Selected dates from Subcarpathian Basins. Calibrated 14C dates from selected localities in Poland are marked by horizontal bars representing intervals of 68.2% confidence.
A climatic deterioration (increase of NAP to 70%, dominance of Betula nana and Artemisia) is evidenced towards the top of the sediment log. The youngest 14C date is only 3820 0 ± 1350 –1100 BP (Hv-6865, 43600–41550 cal BP). Compared with other European and Greenland records, this profile correlates well with the Hengelo interstadial and the next cooling. This series at the Brzeźnica site is dissected. The middle part of the younger 15–20 m thick fill contains the floodplain laminated deposits with distinct cryoturbation dated at 28200+1350–1100 BP (Hv-6864, 33700–31200 cal BP). The pollen spectrum shows 66.8% of herb pollen and 27.3% of shrub pollen. A poor tundra vegetation of this layer coincides well with the cooling on the NGRIP curve (see Figs. 7–8). That terrace is dissected and there is the next younger fill of 10–12 m high terrace with tundra-forest pollen on the left bank of the river (Wola Żyrakowska site) dated at 21350 ± 1200 BP (Gd-9007, 27000–24350 cal BP, probably reworked older deposits), later covered by coarser alluvia containing about 50% AP from the Upper Pleniglacial (Starkel, 1995a; Mamakowa et al., 1997). The incision was very deep also approx. 15 km south, at the margin of the Carpathian Foothills in Podgrodzie site. There, wood pieces found in colluvia were dated at 33350+750–660 BP (Hv-8375, 38500–36700 cal BP) while the sample taken from the alluvial silt 3.5 m above the present water level and containing about 50% AP was dated at 22450 ± 340 BP (Hv-6856, 27150–26350 cal BP; Starkel, 1981). During the cold phase the edge of the Carpathian Foothills was the refugium of trees (Picea, Pinus cembra, Larix, Alnus).
Going downstream along the Wisłoka (in N part of the Sandomierz Basin) the lower fan–shaped terrace is wider and its base is dated at 17830 ± 1330 BP (the Wojslaw depression, Gd-1 6105, 23300–20000 cal BP) and reflects features of a braided river (Gębica, 2004). The younger fill presenting the transition from fluvial deposits with cryogenic features of that terrace near the confluence with the Vistula valley was described (TL dates 29–16 ka, Lab codes UG from 6764 to 6767) through the fluvio-aeolian unit with some cryoturbations (14–13 ka BP, UG 6763 and 6773) to the top aeolian unit dated at the transition from the Younger Dryas to the Holocene (Figs. 8–9, Wojtanowicz, 1996; Zieliński et al., 2014).
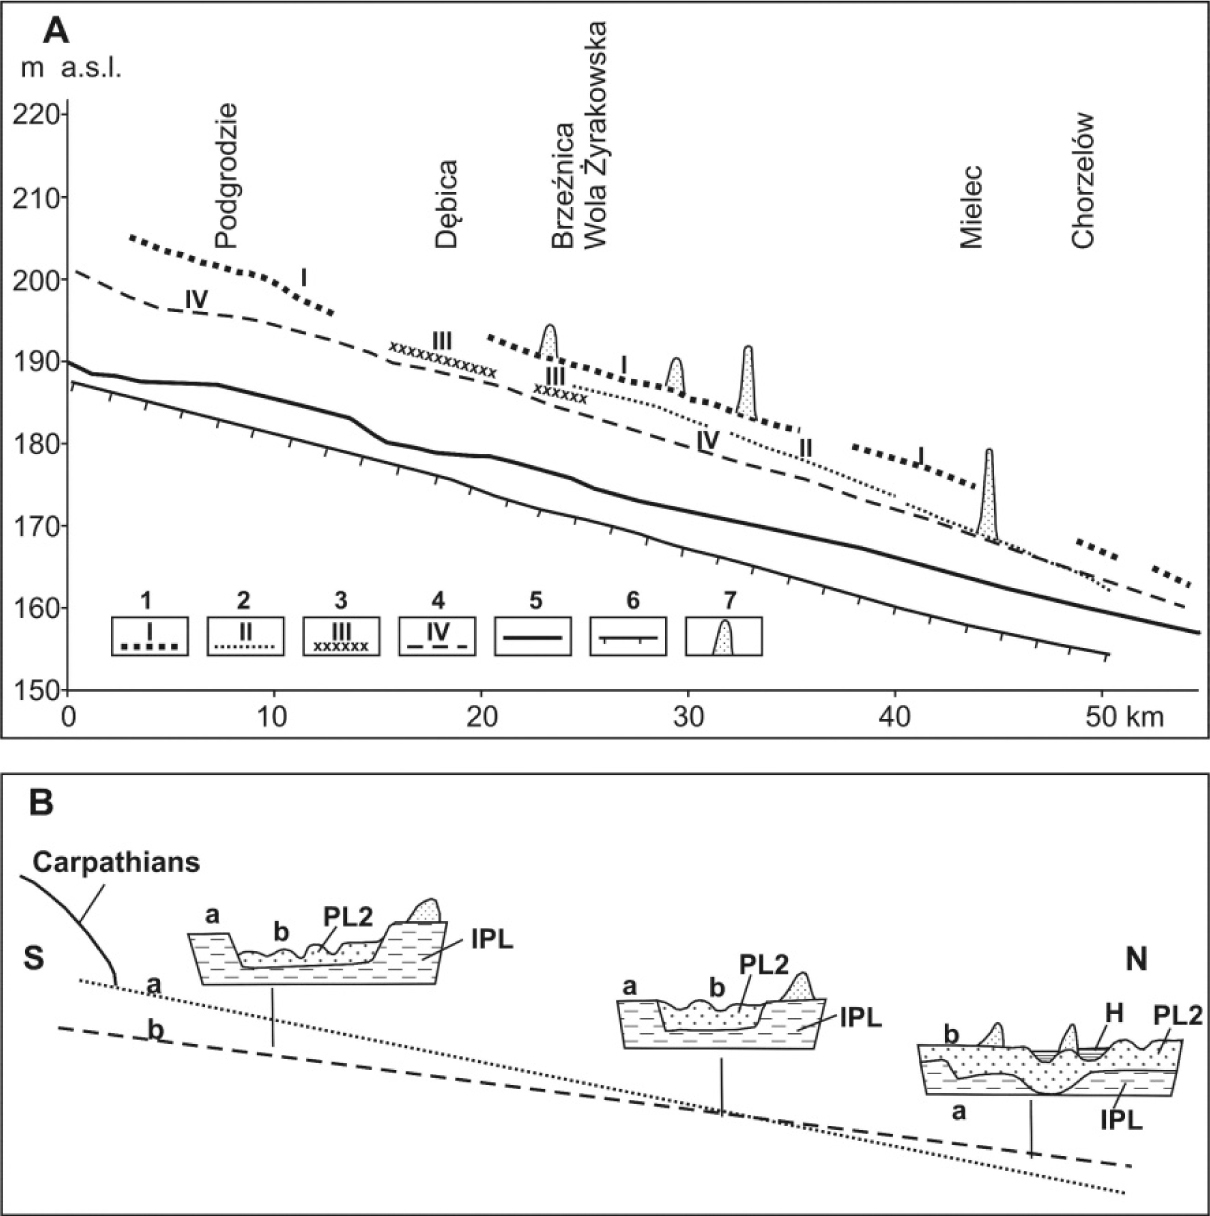
Fig. 9
A. Longitudinal profile of Wisioka river valley (after Gębica et al., 2015): 1 – Middle Pleniglacial terrace (level I), 2 – Upper Pleniglacial terrace (II), 3 – Late Vistulian terrace (III), 4 – Holocene terrace (IV), 5 – river channel, 6 – rock surface (strath), 7 – dunes. B. Model of alluvial fan incision marked by the cutting of Interpleniglacial cover in the close fore-mountain area. The younger (Upper Pleniglacial) fan was inserted in the northern part ot Sandomierz Basin (after Gębica et al 2015).
Oświęcim Basin and the Krakow Gate
A large alluvial fan of the Vistula river, which is covered by a 4–14 meter thick loess, extends at the foreland of the Silesian Beskid Mts. An up to 2 m thick layer of peat and organic silts with a declining % of AP upslope , dated between 35800 ± 2500 BP (Gd-6364, 43400–37650 cal BP) and 29200 ± 1000 BP (Gd-6362, 34250–32050 cal BP) is located in the Pierściec site, above that loess there is. The upper date indicates that the deposition of loess started on the dissected terrace plain (Niedziałkowska and Szczepanek 1993–4).
The alluvial fan of the Biala river, a small tributary of the Vistula, draining the northern slope of the Beskids, exposes 1 m of peat below 5 m of silty-sandy alluvia. The related pollen spectrum changes from an open forest with Pinus and Betula to a tundra, the AP declines from 70% to 30%, while the radiocarbon date at the bottom > 39020 BP changes to 32400 ± 1140 BP (Kaniów, Lv-964, 38050–35300 cal BP, GIS-8) in the upper section and 27470 ± 800 BP (Lv-962, 32500–30850 cal BP) in the organic silt (Gilot et al., 1982) – see Fig. 8.
Upstream of Krakow at the Ściejowice site, the forest-tundra peat occurring below the loess cover (Mamakowa and Środoń, 1977) has been dated at 38300 ± 3600 BP (Gd-2750, 46500–39750 cal BP, Rutkowski, 1993) which coincides with the Hengelo interstadial and GIS 10–12.
At Ludwinów site, a typical Dryas flora spectrum has been obtained from silts resting below the Holocene alluvia, and the appropriate two datings are > 35500 (> 40100 cal BP) and 43000 BP (> 46200 cal BP) (Sokołowski and Wasylikowa, 1984). A low position a.s.l. indicates that the phases of incision and coolings existed during the Interpleniglacial.
Vistula Valley and tributary Dunajec valley
A terrace covered by loess extends 13–17 m above mean river level in the Vistula valley along the scarp between Kraków and Opatowiec (Fig. 8). There are alluvial silts in Nowa Huta, under the loess, the top of which was dated at 27,740 ± 300 BP (Hv-6386, 31,900–31,200 cal BP, Mamakowa and Środoń, 1977), indicating a start of loess deposition in the terrace. In Brzesko Nowe silts with organic content, occurring under the loess in a palaeochannel, were dated from 31,800 ± 600 BP (Gd-10485, 36350–35000 cal BP) to 28480 ± 600 BP (Gd-7813, 33150–31650 cal BP) (Gębica et al., 1998). This indicates the Denekamp interstadial. A fossil soil at the base of the loess, dated at 23000 ± 1600 BP (Gd-9838, 29100–25700 cal BP, Gębica et al., 1998), represents a warmer episode.
On the right bank of the Vistula at Trawniki, the top of alluvial sands was dated using the luminescence method at 69 ± 9 ka (GdTL-251). The above resting silts with unloaded structures were dated at 37 ± 4 ka (GdTL-252, Gębica, 1995). Loess with water fauna, typical for alas lakes, in its upper part was dated at 23 ± 3 ka BP (GdTL253, Gębica, 1995).
In Opatowiec, at the junction of the Vistula with its tributary Dunajec, the fossil soil resting over the alluvia and below loess with aquatic malacofauna was dated at 31200 ± 1400 BP (Gd-2120, 37000–33800 cal BP, Alexandrowicz and Jersak, 1991).
In its lower, 30 km long course, the valley of Dunajec has a shape of a wide alluvial fan. A 2–15 km wide and 8–12 m high Vistulian terrace extends, which is covered by several dunes, extends on the left bank a (Sokołowski, 1995; Gębica, 2004; Gębica et al., 2015). There are two fossil channels filled with 20 m thick complex of gravels and sands with significant amount of material coming from the Tatras in the substratum of the Miocene beds (Sokołowski, 1995). A lower part of the terrace, at the Radłńw site, was dated with the use of TL method at 59 ± 9 ka (Lub-1215), its upper part from 39 ± 6 ka (Lub-1214) – base to 19 ± 3 ka (Lub-1216) - top (Sokołowski, 1995).
In the N-W part of the fan at Włoszyn, the layer of clay with organic content, found in gravels at the depth 2.1 m, was dated at 39100 ± 3000 BP (Gd-5704, 46600–41000 cal BP) (Gębica, 1995; Mamakowa and Gębica, 2015). The subfossil trunk of pine of Szujec dated at 31425 ± 530 (Hv-9708, 35900–34800 cal BP) (Sokołowski, 1995) and the above mentioned clay with organic content of the Włoszyn site indicate a gradual building of a great alluvial Dunajec fan in the Interpleniglacial.
Wisłok and San valleys
The bottom of the San valley and its tributary Wisłok occupy a 8–12 m high Vistulian terrace and a 6–8 m high Holocene one. An erosional step (6–8 m high), with well-preserved Lateglacial palaeomeanders, is locally incised in the San valley in the higher terrace, (Szumański, 1986).
Channel facies sands from a depth of 5.9 m were dated by means of OSL method at 35200 ± 1000 (GdT-L782) in the Wisłok valley at Łukawiec – see Fig. 8. The organic silts, resting above the sands, were deformed by load structures and are dated at 30880 ± 1330 BP (Gd-15466, 36600–33600 cal BP, Gębica, 2004; Pazdur et al., 2006). This channel facies members ended with sands and an erosional surface covered by alluvia dated using the OSL method at 22800 ± 840 (GdTL-781). This unit is dismembered by contraction cracks, and it gradually changes in horizontally laminated fluvio-eolian sands, which are OSL dated at 14300 ± 520 (GdTL-780) and 12590 ± 530 (GdTL-779) (Pazdur et al., 2006; Superson et al., 2010).
The interfluve of the Wisłok and the San occupies the 8–10 m high plain, covered by dunes. In the lower alluvia, at Wólka Ogryzkowa, the silty organic layer sampled from a depth of 7.5 m was dated at 27800 ± 2450 (Gd-9972, 35300–29350 cal BP, Wójcik et al., 1999).
A peat layer has been dated at
Older sands building the North-Eastern part of the Sandomierz Basin have been reworked by eolian activity and are forming dunes in shapes of elongated ridges with 3 TL dates: 29, 28 and 22 ka. In the neighbouring Lublin Plateau, the same eolian activity led to formation of thick loess cover (Wojtanowicz, 1999).
The dated Interpleniglacial alluvia in various parts of the Subcarpathian Basins indicate the presence of at least 2 or 3 alluvial fills sometimes with organic horizons which are either incorporated in alluvial members or separating them. Their stratigraphic positions vary and generally correlate well with the NGRIP δ18O curve. The organic horizons of about 34–32 ka cal BP covered by the loess blanket on terraces indicate the beginning of a general cooling coinciding with an onset of the deepening of river channels and eolian activity. The principal changes from the unstable Interpleniglacial climate to the continental arid climate (Maruszczak, 1980; Starkel 1995c, Vandenberghe et al., 2014) occurred. The delayed (up to 3–4 ka) dissection of flood plain caused the delayed start of loess deposition at some localities (Fig. 8).
Changes in Lublin and Roztocze Uplands
A great part of South Polish uplands is covered by loess which has been dated and assigned to various parts of the Vistulian mainly using TL and OSL methods (Maruszczak, 1980 and many others). Interpleniglacial underdeveloped soils separate thin loess horizons, which indicate short phases of eolian activity. Frequently, this Interpleniglacial loess unit is totally missing (Łanczont and Wojtanowicz, 2012). The main loess complex represents the period between 30 and 15 ka. Many indicators of permafrost like polygons with syngenetic and epigenetic ice wedges as well as sand wedges and involutions were found in it. Two fills are characteristic in the river valleys. The older one represents the Interpleniglacial. It is up to 20 meters thick and builds the 15–20 m high terrace, representing mostly the phases between 40 and 30 ka (Harasimiuk, 1991; Superson, 1996; Superson and Zagórski, 2003 – Fig. 10).
Fig. 10
Alluvia in Wieprz valley at Latyczów (after Harasimiuk, 1991). 1 – sand with gravel, 2 – sand, 3 – silty sand, 4 – mud, 5 – loess, 6 – fossil soil, 7 – ice wedges, 8 – involutions, 9 – small deformations, s – recent (Holocene) soil, f – floodplain deposits, l – natural levees deposits, ss – soil sediments.
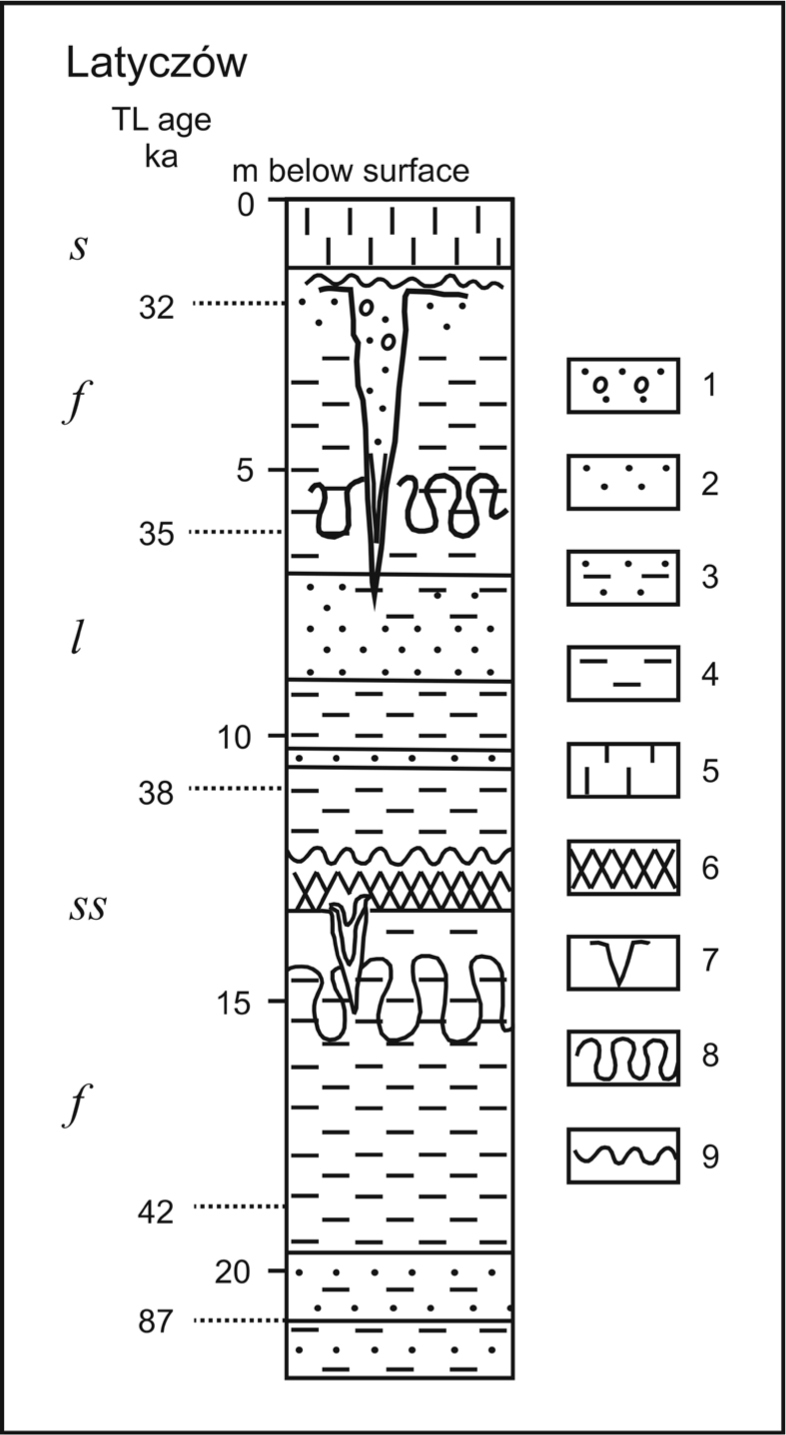
The profile in Latyczów, studied by Harasimiuk (1991), exposes 20 meters of alluvial sands and loams with 4 TL dates between 42 and 32 ka BP (42, 38, 35 and 32 ka – the last date below the present soil). There are 3 – 4 distinct depositional units with at least two horizons with pseudomorphoses of ice wedges in this sequence. However, we do not know how many events (floods?) built that interesting sequence. The incision took place after 32 ka. The entire profile correlates very well with the δ18O curve from Greenland, where a longer cold episode occurs just before 38 ka and the next similar ones – about 36, 34, 33 and the longer one after 32 ka (Fig. 8). In the Wolica valley, the last fluvial aggradation is dated at about 23 ka BP (Superson and Zagórski, 2003), which seems to coincide with the last short warmer episode over Greenland (Fig. 8).
The alluvial deposition ended 31–28 ka BP (Buraczyński, 1996) in the upper segments of the valleys, e.g. with the start of climate cooling and increased aridity, reflected both in the intensification of loess deposition and downcutting of rivers (cf. Starkel et al., 2007). Later on, that incision was followed by the deposition of subsequent fill, building the 8–12 m high terrace dated by C-14 and TL method at 19–12 ka BP (Jersak et al., 1992; Superson, 1996). That terrace was gradually dissected during the Lateglacial, which led to the forming of two lower steps (Superson, 1996 and others). It is characteristic here, as in the case of the Carpathian valleys, the warmer phases with a tendency of degradation of permafrost were also present in the periods of aggradation in the river valleys (Starkel et al., 2007). Similar trends were observed in the fragment of the Sandomierz Basin, which is not fed by the Carpathian rivers like the Sanna, where Łążek site revealing a short warm episode is located (Buraczyński, 1998).
. Discussion
Our study does not have the rank of synthesis, but rather the preliminary correlation. This is due to the lack of sufficient sites elaborated in detail. One should also pay attention to the resolution of datings available for the Interpleniglacial period. For sites, cited in previous chapters, only single 14C and luminescence dates are available, and the accuracy of these dates is usually the order of a thousand years. Such a resolution of dates does not allow an accurate chronology of events, comparable to the chronology of the NGRIP to be developed.
We should not forget, in this context, about the relation of dated material to the dated events (Starkel et al., 2006, 2015). In the case of fluvial processes and sediments, the dated material indicates an event that may have occurred before or after the date. Sometimes, we may incorrectly attribute the role of longer time spans to the dated short episodes (Starkel, 1960).
Detailed investigations of ice cores from Greenland showed that in the Interpleniglacial period we were dealing with the rhythmic fluctuations with variable length of warm and cool phases, with an entire cycle (warm phase + cool phase) length of one thousand to four thousand years. However, previous studies of Interpleniglacial sediments in South-Eastern Poland pointed to existing simple diagrams of stratigraphic divisions, in which only two warm interstadial phases were distinguished in the younger part of Interpleniglacial – Hengelo and Denekamp. With this scheme, an attempted was made to correlate profiles with single 14C dates. Some dates were inconsistent with such a scheme. The possibility of less than several thousand climatic variations recorded in sediments was not taken into account. Although at the time, they were already known short variations of the Late Glacial well recorded in sediments.
The pace of change in the conversion / development of permafrost and changes in vegetation in the Late Glacial period suggest that much shorter (than previously thought) rhythmic fluctuations of climate stored in sediments may have occured in the Interpleniglacial period in South-Eastern Poland. For this reason, the authors propose to look at the existing dating results in light of climate changes recorded in the ice cores in Greenland. Current knowledge about the fast (even several decades) climate changes recorded in Late Glacial and Holocene sediments entitles us to a hypothesis that is to be expected that the rapid climate change in the Interpleniglacial period are to be recorded in terrestrial sediments. The difficulty lies in the fact no sites with continuous sedimentation were found that on territory of South-Eastern Poland. We only have fragmentary records. The authors reviewed the most important Interpleniglacial sites in the Carpathian Mountains, Subcarpathian Basins and Lublin Upland with Roztocze and tried to link them to the δ18O curve from the NGRIP profile. This allowed the previous difficulties of interpretation to be removed. For example, the Łążek site with the forest flora, located within the aeolian deposits (probably related to periglacial climate) can be, in light of the Greenland curve, interpreted as the site from short period of warming around 33.5 or 32 or 29 ka cal BP. Another example are sediments with the Dryas flora (Brzeźnica site) dated to 34–32 ka cal BP, which occured in a several meter alluvial series (undoubtedly interstadial). This means that the short phases also find reflection in vegetation or in fluvial sediments. The Latyczów site serves as another example of a climatically controlled alluvial sequence with several cyclic changes (Harasimiuk, 1991). It appears that the cited profiles are consistent with the Greenlandic curve, which can be, according to the authors, a guide in the reconstruction of climate change in South-Eastern Poland during the Interpleniglacial. The previously existing models of stratigraphy are not sufficient and need revision following the 18O NGRIP curve (Fig. 11).
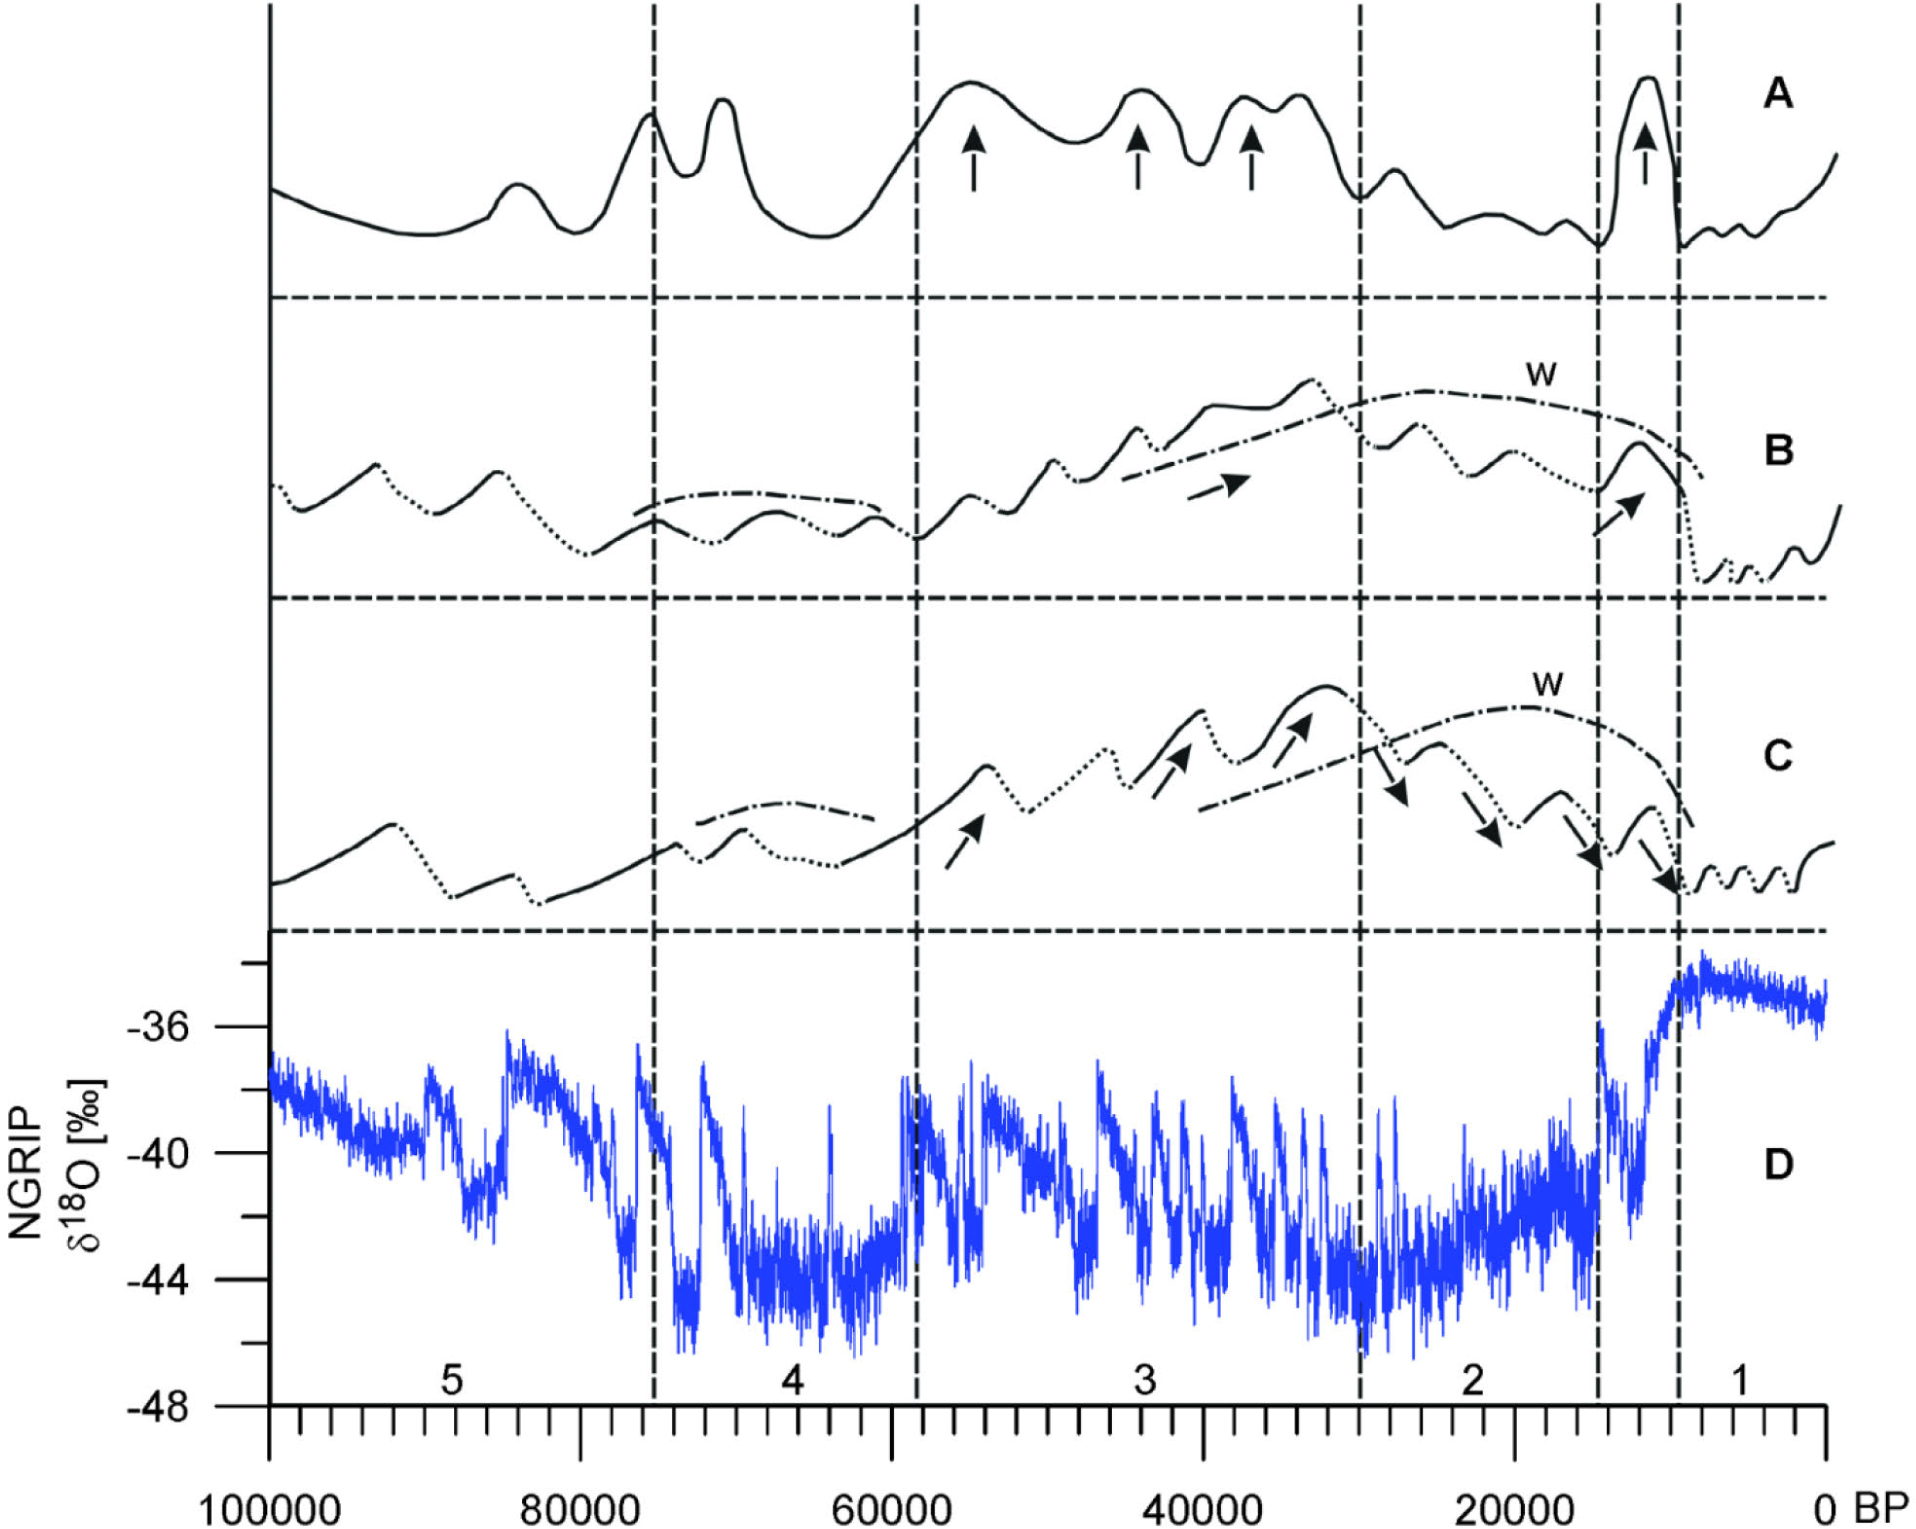
Fig. 11
Type and intensity of processes during the Vistulian in C-E Europe in relation to the δ18O curve from Greenland (schematic reconstruction): A. Intensity of denudation on mountain slopes, B. Tendency to aggradation and to erosion in mountain valleys, C. Tendency to agradation and erosion in submontaneous basins, D. δ8O curve from Greenland. Main stratigraphic units 1–5, w – phases of intensive aeolian activity.
In this review of the mainly older studies, even dating from 1960’s on Interpleniglacial carried out in South-Eastern Poland, we conclude a very good agreement of various records of climatic fluctuations dated by 14C method as well most of the TL and OSL datings with the NGRIP curve (Rasmussen et al., 2014). However, some main phases are clearly underlined (particularly the Hengelo, the Denekamp).
We should also pay more attention to the spatial diversity of plant communities or permafrost phenomena dependent on mezorelief, soils, hydrology etc. In reality, side by side swamps and dry grasslands, as well as discontinuous permafrost, besides insular and seasonally frozen grounds had existed. In the mountains vertical zonality and asymmetry of slopes occurred. The expansion of plants or the maturing of soils also might follow with a delay in relation to the climatic changes (especially warmings). In effect, the elements of the current geoecosystems (latter described as “refugia”) may even be inherited from the past phases.
Detailed studies conducted by the Polish team (Klimek and Starkel, 1980; Starkel and Kowalkowski, 1980; Kowalkowski and Starkel, 1984) in the Khangai Mountains (central Mongolia), in the zone of discontinuous permafrost show a great diversity of vegetation and frost processes and indicate the need for great caution in environment reconstruction during the Interpleniglacial. One should also keep in mind that the preserved profiles sometimes represent the extreme conditions of the ecosystems of that time.
The present day processes of very intensive solifluction in Eastern Siberia during actual warming show similarities with very rapid permafrost melting during the beginnings of interstadial warmings. Very thick solifluction covers in the Flysch Carpathians (like the Dobra profile) could be the result of such processes in the past.
At present, we usually prefer to study the effects of extreme events, changes of longer duration or reconstruct extreme values as the maximum extent of permafrost, deepest freezing (Vandenberghe et al., 2014) forgetting about the actual duration of such a phase and even about its role in landscape evolution. Studying long epochs with a focus on extremes we forget about the scale of transformations and duration of transitional periods. Stage 3 (the Interpleniglacial) played a much more substantial role in the transformation of geoecosystems than it was assumed. Later, the relatively shorter Lateglacial phase had also totally changed fluvial systems as well as plant communities.
In the temperate zone (the former periglacial zone) the transitional phases, being instable like the Interpleniglacial and the Lateglacial, were the periods of destruction of the inherited structures as well as of the initiation of forming the new ones. The Interpleniglacial, with its frequent short cyclic climatic changes that comprised rapid warmings and gradual coolings, retreats and the expansion of permafrost, was especially productive in the transfer of sediments and the transformation of relief. The accelerated degradation in the mountains combined with the rapid retreat of permafrost and a change in the position of the upper tree line has been reflected in the phases of solifluction on mountain slopes and the phases of intensive fluvial aggradation in the sub-mountain depressions.
. Conclusions
- Diversity of dating results suggests a more complicated picture of the Interpleniglacial than was previously accepted (Zagwijn, 1974; Vandenberghe, 1992 and many others).
- Cited dispersed dates show the picture, which is in accordance with the oxygen curve from the NGRIP profile (Figs. 1 and 11): treeless tundra appeared during the colder stadial and, opposite, the open forest appeared during every interstadial.
- On the NGRIP δ18O curve we find several shorter phases besides the Hengelo and the Denekamp. They are also found in South-Eastern Poland
- Similar changes very well recognised in the Late Glacial profiles (B⊘lling, Aller⊘d or Younger Dryas) prove the statement that similar shorter cyclic fluctuations existed during the Interpleniglacial and they should be recorded in sediments (principle of uniformitarism)
- Thick solifluction deposits mainly represent the beginning of interstadial phases during the Interpleniglacial.
- The end of Interpleniglacial coincides with the start of loess deposition and the expansion of the Scandinavian ice-sheet.
- The authors suggest more attention should be paid to a spatial diversity of sediments and forms dependent on a type of substratum, local relief, and topoclimate.