
. Introduction
Fluvio-aeolian environments in the European Sand Belt (ESB) experienced significant changes during the last glacial-interglacial transition (Koster, 2005). Such sedimentary successions exhibit cyclical periods of cooling and warming that manifest themselves in two different ways. Cold periods resulted in increased sediment influx, leading to the accumulation of fluvial and aeolian sediments. Rapid aeolian accumulation, in particular, buried existing soil levels (Kasse and Aalbersberg, 2019). During warm periods, rivers incised and formed terrace systems (Vandenberghe et al., 1994), while aeolian coversands and dunes affected soil-forming processes (Sokołowski et al. 2022). Fluvio-aeolian successions are ideal for radiocarbon (14C)- and luminescence-dating methods, allowing good chronologically constraint paleoenvironmental reconstructions in the period of time we are interested in.
Aeolian cover sands and aeolian dunes in the central part of the ESB consist mainly of quartz with limited admixture of feldspars and other silicates as well as reveal good sorting of usually well-rounded material (Woronko et al., 2015; Rychel et al., 2018). This makes this type of sediment difficult for plants to colonise and vulnerable to any change in environmental parameters. It leads to the destruction of the vegetation cover that creates the conditions for the development of soils and favours the re-activation of aeolian processes and the deposition of sandy covers on pre-existing soils (Kappler et al., 2019).
The large amount of charcoal of various sizes in the Late Glacial palaeosols indicates the large role of fires in the formation of vegetation cover and soils on the dune surface (Kaiser et al., 2009). The centennial–millennial frequency of wildfires varied during the Last Glacial Termination (LGT) and Early Holocene. It is related to the climate oscillations and changes in plant cover (Tolksdorf et al., 2014; Tsakiridou et al., 2020) as well as human activity (since the development of farming activities i.e., 7000 years ago) (Doyen et al., 2015).
Luminescence dating, predominantly using optically stimulated luminescence (OSL) on quartz grains, has greatly improved stratigraphic schemes by dating extensively exposed fluvial and aeolian deposits (Kaiser et al., 2009; Moska et al., 2020, 2022). It is rare to encounter a situation where the luminescence and radiocarbon methods create a perfectly interlocking chronostratigraphy for dune profiles, as is the case, for example, with the Zborowskie site (Moska et al., 2023). Cross-checking the results of OSL and radiocarbon dating allows the creation of more reliable stratigraphic schemes. Therefore, for the reconstruction of environmental changes recorded in fluvio-aeolian succession, profiles with multiple soil and organic horizons play a particular role.
One of the key sites where aeolian complex is intercalated with palaeosol and organic layers enriched in charcoals is the Korzeniew site, central Poland. The objectives of the present study are (i) to reconstruct chronology of the studied succession on the basis of OSL/14C dating results comparison; (ii) to establish a frequency of wildfires and their role in soil-forming processes; and (iii) to correlate chronology of wildfires with Late Glacial climate changes in the ESB.
. Study Area and Regional Setting
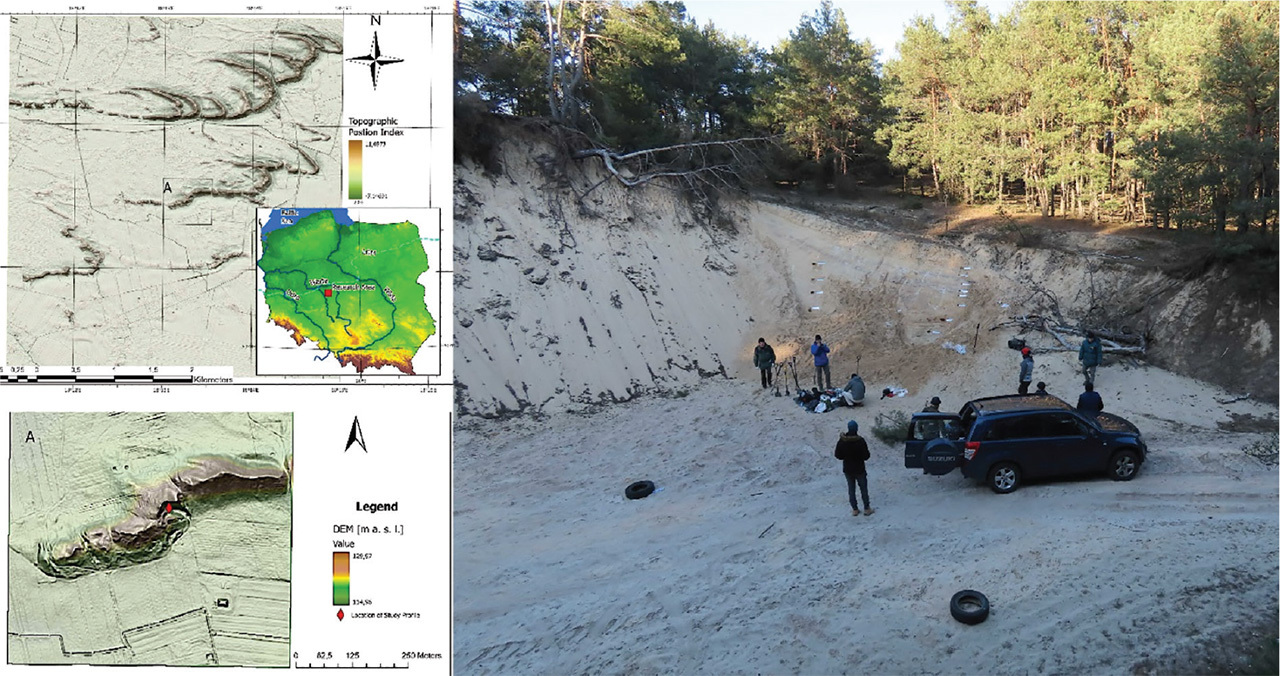
The Korzeniew site is located in the eastern Wielkopolska region, central Poland (Fig. 1). It is situated in a complex parabolic dune, located on the interfluves of two small river (the Czarna Struga and Powa Rivers) tributaries of the Prosna River and the Warta River and approximately 25 km to the south from the Last Glacial Maximum (LGM) (Fig. 1). The outcrop is in the lee-side of the dune and is 10 m in the highest point, 60 m long and 40 wide. The detailed studies were performed in the eastern part of the exposure in two profiles (Fig. 2).
Fig 1.
Location map of Korzeniew site based on DEM (source: www.geoportal.gov.pl) with the aerial view of the investigated profile. DEM, digital elevation model.
The thickness of the Quaternary sediments is approximately 50 m. They are underlain by Miocene clay sediments. The Quaternary unit consists mainly of glacial tills of the Middle Pleistocene age (Trzmiel, 1995). During the LGM, glaciofluvial sand with gravels were deposited in front of an ice-sheet. In the same period, the extraglacial Prosna River and its tributaries deposited 5–10 m thick sandy-silty covers in the northerly direction. In the last glacial termination (LGT), two fluvial terraces were formed due to the Warta River incision and its tributaries (Kozarski et al., 1988; Dzieduszyńska et al., 2014). The investigated aeolian cover lies directly above the Late Weichselian fluvial complex. The fluvial terraces and glaciofluvial covers were the main source of the aeolian sands in the investigated dune complex.
. Materials and Methods
. Lithological Analysis
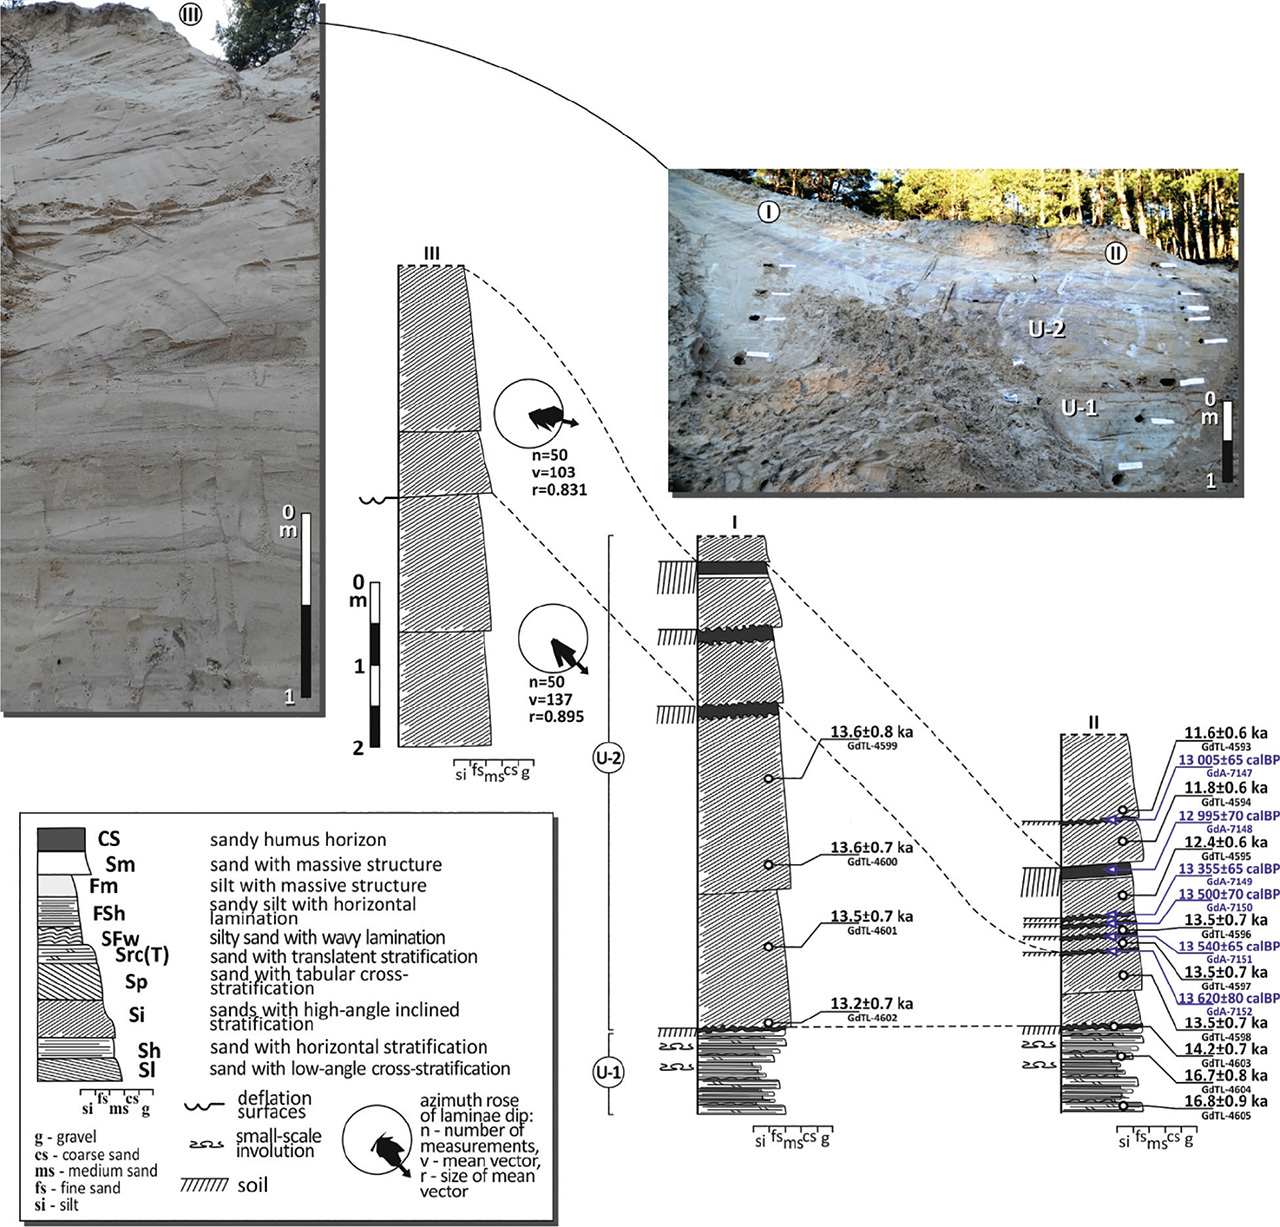
The studied outcrop was analysed in two parts. In the central part, where aeolian sediments reach maximum thickness (approximately 10 m) only general lithofacial analysis and palaeotransport direction was measured. Detailed studies were conducted in the eastern part of the outcrop on the lee-side of the dune foreset. In 2 profiles, 13 samples for OSL dating and 6 samples for radiocarbon dating were collected (Fig. 3). For aeolian deposits, the methodology of lithofacial analysis proposed by Zieliński (2016) was used.
. Palaeopedological Analysis
The lithological analyses were complemented by pedological observations. Soil horizons were identified along with their morphological features. Symbols of soil horizons were used in accordance with the international standards (Jahn et al., 2006). The pedological characteristics are complemented by laboratory spectrophotometric analyses performed on dried samples and sieved on a 2 mm sieve. Samples taken in the field at an interval of 3 cm were used for these analyses. Measurements were made on a SFX50 spectrophotometer produced by 3Color company, allowing measurements at an observation angle of 10° and a D65 norm-light calibration. The parameters measured were luminance (L*), redness (a*) and yellowness (b*). Low L* values correspond to an increased presence of black particles, which should be associated with A-horizon and/or the presence of dark additives (e.g., charcoals). The redness a* is commonly interpreted as reflecting weathering intensity (Yang and Ding, 2003). The parameter b*/a* reflects changes in the relationship between two parameters, while the R index to indicate the haematite in soil was calculated via formula (Barrón and Torrent, 1986). In order to generate true colours, reflecting the natural colours of the samples, R tuning was performed as proposed by Sprafke et al. (2020). Maximum tuning was achieved in the fourth step. This result (Rmax) was used in the visualisation of the analysis results. In addition, for the horizons with extreme tuned colours, their values were calculated according to the Munsell colour chart (2° observation angle, C light type), simplifying the designation (hue, value, chroma) to classic codes. The latest software Color QC was used in the colour analyses.
. OSL
Luminescence dating samples were extracted from the most representative sections of a pristine vertical outcrop using thin-walled steel pipes. The luminescence measurements were conducted at the Gliwice luminescence dating laboratory (Moska et al., 2021). For the determination of dose rates, high-resolution gamma spectrometry was employed, utilising an HPGe detector manufactured by Canberra (This approach determined the U, Th and K content in the samples following the laboratory protocol (Moska et al., 2021). Dose rates were computed through an online dose rate calculator (Tudyka et al., 2023), which incorporates the latest conversion factors. It was assumed that the average water content for nearly all samples was (5 ± 2%). However, for two specific samples, GdTL-4602 and GdTL-4603, the measured water content was approximately 15%. Consequently, a value of 15 ± 3% was utilised for the final calculations for these samples. All essential data for dose rate calculations are detailed in Table 2.
For OSL measurements, coarse quartz grains (125–200 μm) were isolated from sediment samples through a standard process involving treatment with 20% hydrochloric acid (HCl) and 20% hydrogen peroxide (H2O2). These quartz grains were then subjected to sieving and density separation using sodium polytungstate solutions, resulting in grains with densities ranging from 2.62 g/cm3 to 2.75 g/cm3. The final step involved etching the grains with concentrated hydrofluoric acid (HF).
Automated Risø TL/OSL DA-20 readers equipped with a calibrated 90Sr/90Y beta source were utilised for OSL measurements. This source delivered approximately 6.0 Gy/min to the grains at the sample position, with a 6 mm Hoya U-340 filter used during OSL measurements. The determination of equivalent doses employed the single-aliquot regenerative-dose (SAR) protocol (Murray and Wintle, 2000). The final equivalent dose (De) values for all samples were calculated using the Central Age Model (CAM, Galbraith et al., 1999) through the R package ‘Luminescence’ (Kreutzer et al., 2020). The resulting age distributions are displayed in Fig. 4, illustrating relative probability density functions (Berger, 2010). The overdispersion parameter for all samples remained well below 20%, with unimodal distributions indicating that the tested material represents a group of well-bleached quartz (Moska, 2019), allowing the application of the CAM model for the final equivalent dose calculations.
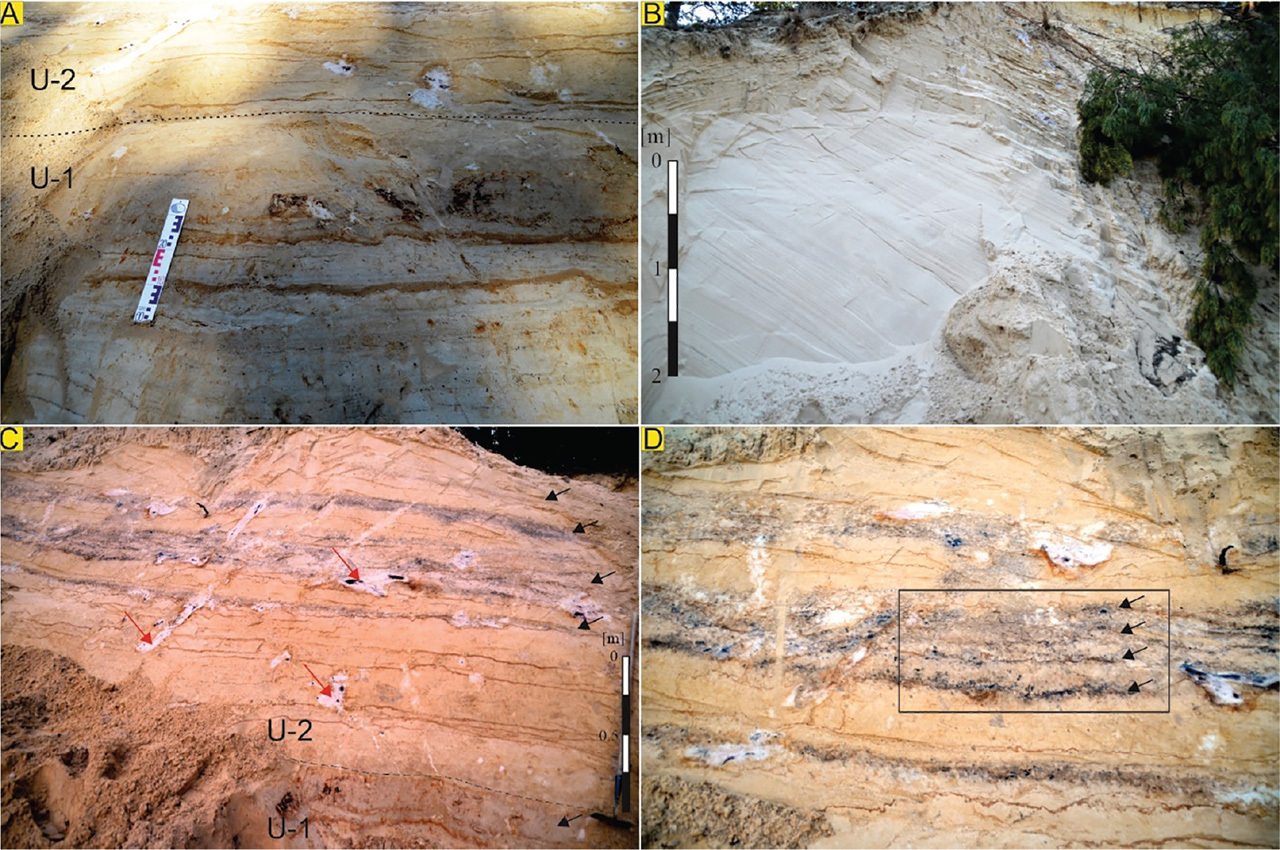
Fig 4.
(A) – Sandy–silty rhytmite with horizontal and wave lamination of the unit 1; (B) – inclined cross-stratification (Si) of the dune foreset (U-2) in the central part of the dune complex; (C) – Distal slope of the dune foreset with palaeosols (black arrows) and remnants after present-day root structures (red arrows); (D) – the composite palaeosol complex with four layers of charcoals (black arrows). Notice finger-like structure of the palaeosol below.
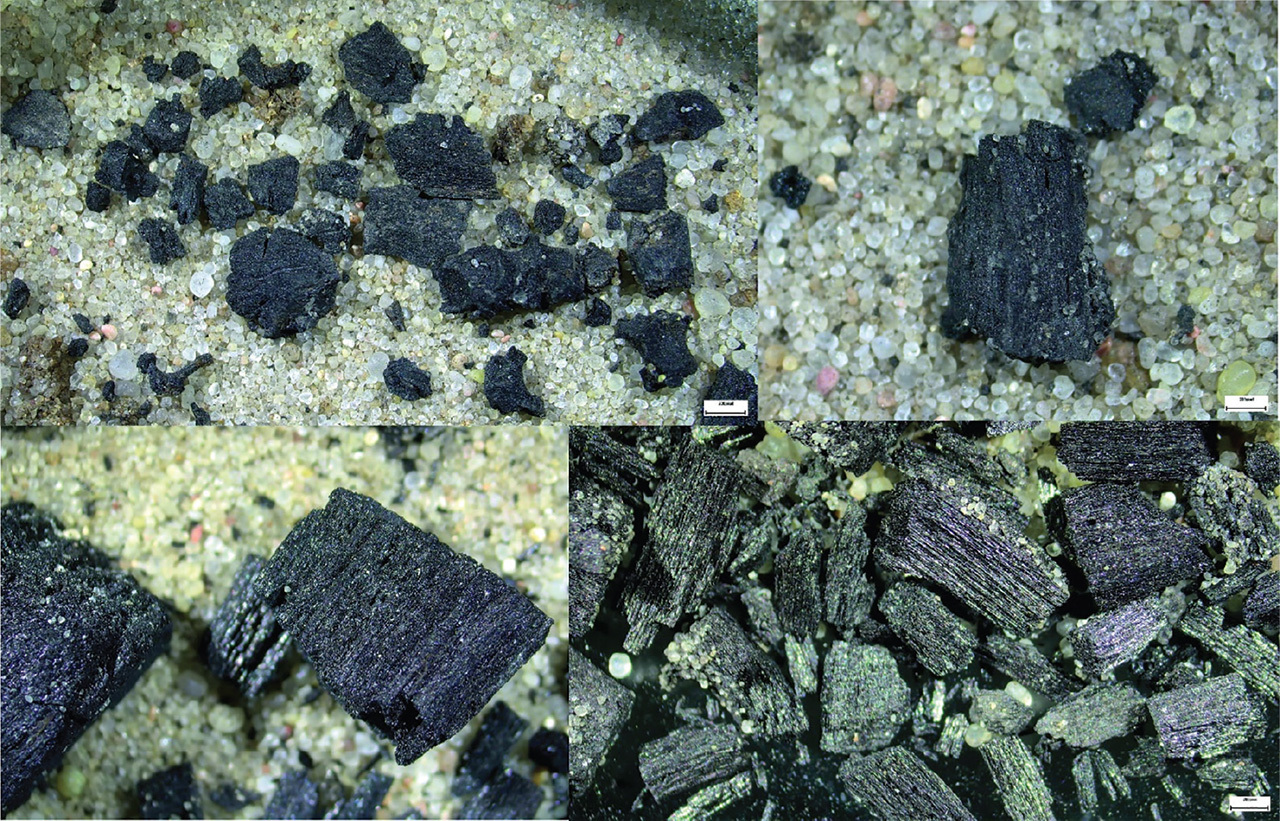
. Radiocarbon Dating Procedure
Six samples were collected for radiocarbon dating. For all investigated samples, about 100 g of sediments that contain dozens of tiny pieces (about 1 mm or less) of charcoal were taken. In the Gliwice Radiocarbon Laboratory, it was possible to extract several small pieces of charcoal from this sediment, which were enough to create a graphite target for dating. Charcoal fragments for radiocarbon dating were selected from each post-fire level. Before charcoal extraction, all samples were analysed using optical microscope with attached high-quality digital camera, which made it possible to carry out a preliminary characterization of the organic material used in the 14C dates. As expected, all samples contained well-preserved charcoal material (see Fig. 2).
For all samples, typical chemical pre-treatment based on the AAA (acid-alkali-acid) method was used before radiocarbon dating. The AAA pre-treatment involved rinsing the samples in hot HCl (0.5 M, 85°C, 1 h) followed by an NaOH (0.5 M, 85°C, 1 h) bath and final HCl wash (0.5 M, 85°C, 15 min.). Between treatments, the samples were rinsed with demineralised water. In the radiocarbon accelerator mass spectrometry (AMS) technique, the 14C concentration was measured in graphite prepared from the carbon contained in the sample. For this purpose, a line for preparation of graphite targets in the Gliwice 14C laboratory was used. All 14C results were calibrated using the OxCal program (Bronk Ramsey, 2009) and the IntCal120 calibration curve (Reimer et al., 2020). The results are presented in Table 1.
Table 1.
Radiocarbon dating results before and after calibration.
Table 2.
All-important data for investigated luminescence samples: code, depth, radionuclide concentration, dose rate, equivalent dose (CAM model) and final age.
. Results
. Lithology
Two depositional units were distinguished based on the lithofacial analysis (Fig. 3). The lower unit (U-1) consists of fine-grained sands with horizontally or translatent stratification and silty sands with wave and horizontally lamination (Fig. 4A). The lower boundary was uncovered and available thickness was 1 m. Sediments in the upper part contain precipitates of Fe and Mn hydroxides and bear traces of transformation by soil processes. They also show traces of gleying.
Upper unit (U-2) is composed of fine- to coarse-grained sands with inclined stratification in large scale with reactivation surfaces (Figs. 3 and 4B). The unit is 10 m thick in the central part and to 2 m thick in the lee-side of the dune. The orientation of the inclined layers is in the SE direction in the bottom part of unit and E – in the upper part. A deflation surface has been documented in the middle part of the series, which separates lithofacies of different orientations (Fig. 3). On the distal slope of the dune, there are seven palaeosols separated by sandy layers (Fig. 4C). The palaeosols are enriched with charcoals.
. Palaeosols and Radiocarbon Dating Results
Seven soil units were identified on the lee-slope of the analysed dune (Fig. 4C). Relatively low values of the L* index (Fig. 5) reflect the presence of buried humic horizons (Ab), while high values are typical of sands without soil changes and fossil eluvial soil horizons (Eb). Similarly, the parameter b* (yellowness) reflects the lithology of the sequence. Sand samples and enrichment horizons have relatively high b* values, while humic horizons (Ab) have significantly lower values. Digitally measured Munsell colours for the sand layers are generally yellow (2Y), and yellow-red for the pedogenically altered horizons (YR), but with different hue, value and chroma.
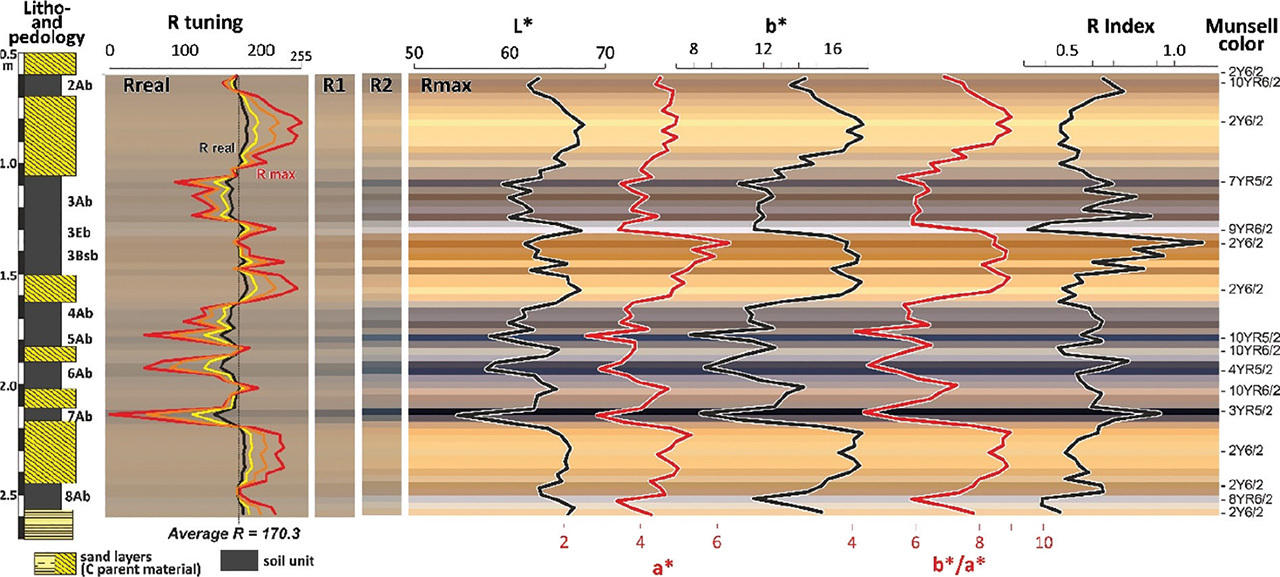
Among these palaeosols, six soils have a simple A–C horizon structure. Sharply discernible from the neighbouring layers, the thin (~10 to 20 cm) humic horizons are the only horizons with evidence of soil changes. These horizons are rich in chaotically distributed charcoals with diameters often exceeding 1 mm. They are accompanied by biogenic channels filled with lighter and darker material, linked by adjacent layers of sand or other soil horizons.
Only the third soil from the top of the exposure has a much better developed profile: 3Ab-3Eb-3Bsb-3Cb with a total thickness of 50–60 cm (Figs. 4D and 5). The soil has a complete profile and the boundaries between horizons are usually transitional. The A horizon has a heterogeneous internal structure, showing layering and enrichment in iron compounds – these features are clearly visible in the abrupt changes in the values of all spectrophotometric parameters (Fig. 5). The diagnostic fossil endopodones are: eluvial (E) and enrichment (B) with thickness, respectively, of 6 cm and 25 cm. The upper horizon is characterised by significant depletion, while the lower is enriched with iron compounds. In spectrophotometric analyses, this is seen above all in the decrease (E horizon) and subsequent increase (B) of the R index, as well as the a* parameter (reddening). Changes in these parameters also correspond to changes in Munsell colours – the entire soil sequence is yellow-red (YR), including the E horizon (9YR6/2), which viewed macroscopically (field description) and in computer R tuning has reached an almost white colour.
In the simple palaeosols, a large number of well-preserved charcoals (Fig. 2) could be distinguished, indicating a high likelihood that this material represents post-fire horizons. These four distinct sediment layers contain charcoal fragments resulting from wildfires or human-induced fires (Fig. 4D). The obtained results are presented in Table 1.
The two youngest results represent the same soil horizon, which underwent stratification. Both dating results GdA-7147.1.1 and GdA-7148.1.1 show astonishing agreement at 13,005 ± 65 calBP and 12,995 ± 70 calBP. The highest layer is considered to be a layer that was reworked from the same fire event as the layer below. This layer was deposited on a soil cover with active podzolization soil processes. The subsequent post-fire layers in the central part are represented by the results GdA-7149.1.1 at 13,355 ± 65 calBP, GdA-7150.1.1 at 13,500 ± 70 calBP, and GdA-7151.1.1 at 13,540 ± 65 calBP. In our opinion, the horizon represented by the result GdA-7149.1.1 is an independent event, while the horizons below may represent the same past fire event. From a statistical point of view, both results are similar, and their presence can be explained in a similar way to the two highest layers.
No charcoal fragments could be extracted from the lowest palaeosol (8Ab), so we have no results for that layer. This palaeosol has a completely different character, as evidenced by its increased Fe and Mn hydroxides content, which is evident in the abruptly higher R index value relative to the adjacent sand layers (Fig. 5).
. OSL Dating Results
Samples for OSL dating were collected from two closely spaced profiles (Fig. 3) in order to capture sediments from both the dune slope and the main part of the dune, as well as the underlying aeolian sands and silts. This approach enabled the determination of the sequential deposition of units, primarily in a horizontal direction. All 13 samples taken for OSL dating represent distinctive chronostratigraphic layers. The sampling strategy was carefully designed to establish the best possible correlation between OSL chronostratigraphy and radiocarbon dating. The obtained results are presented in Table 2. Additionally, all probability distributions for the equivalent dose are depicted in Fig. 6.
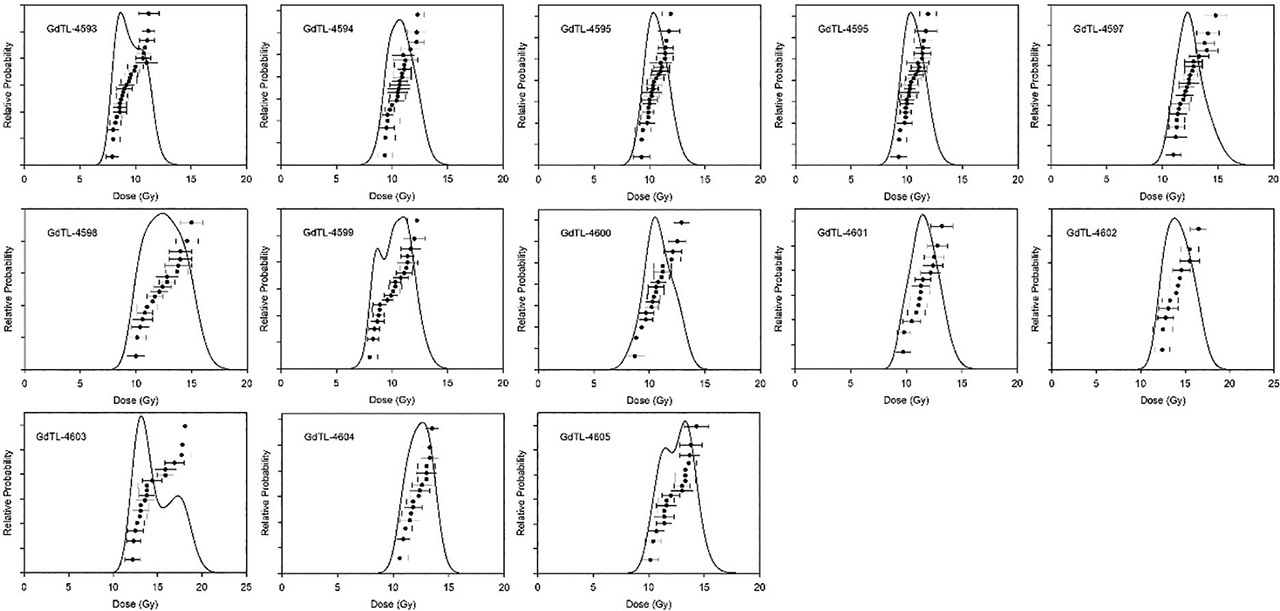
Dose distributions have unimodal character, suggesting that the quartz bleaching process during redeposition occurred correctly (Fig. 6). From the perspective of luminescence stratigraphy, we can observe that the two youngest results for the last aeolian phase, 11.6 ± 0.6 ka (GdTL-4593) and 11.8 ± 0.6 ka (GdTL-4594), are very similar and correspond to the final part of the Younger Dryas period. Sample GdTL-4595 with a result of 12.4 ± 0.6 ka appears slightly underestimated compared to GdA-7148.1.1 (12,995 ± 70 calBP). The next seven OSL results, from GdTL-4596 to GdTL-4602, are surprisingly convergent, indicating a time range from 13.2 ka to 13.6 ka and clearly indicating that the main aeolian part of the Korzeniew profile originated in the Allerød interstadial period. Sample GdTL-4602 with the result of 13.2 ± 0.7 ka looks slightly younger due to different dose rates, which is approximately 20% higher than the other samples. Similar situation is observed for sample GdTL-4603, but, in this case, the final result 14.2 ± 0.7 ka may be associated with Bølling interstadial. The last two samples, GdTL-4604 and GdTL-4605, with results of 16.5 ± 0.8 ka and 16.7 ± 0.9 ka, respectively, come from the fluvio-aeolian part of the profile and correspond to the final part of the Late Pleniglacial (so-called Oldest Dryas) period.
. Discussion
The investigated profile in the Korzeniew site contains remarkably interesting aeolian succession enriched in charcoal layers, presumably of post-fire origin (Van Hoesel et al., 2012). Cross-checking of radiocarbon and OSL dating results reveals a consistent chronological model and suggests that we are dealing with at least four independent fire events occurring during the Allerød interstadial period (Fig. 7).
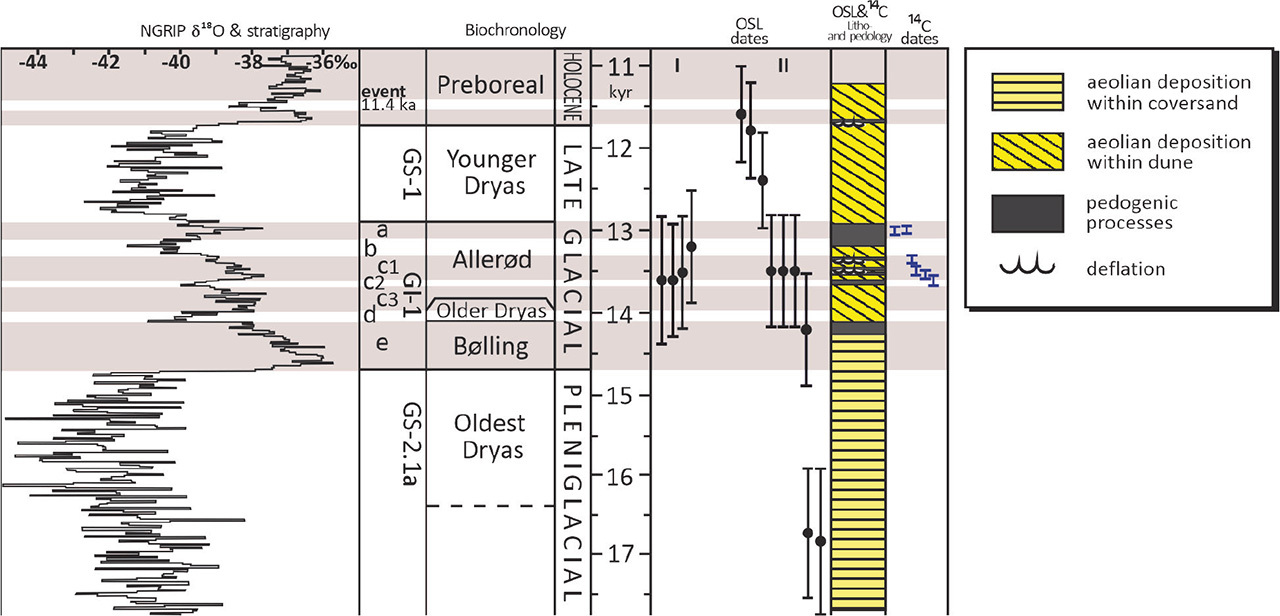
Fig 7.
Age model of depositional and soil processes in the Korzeniew site. 18O/16O ratio after Rasmussen et al. (2014). OSL, optically stimulated luminescence.
The initial aeolian deposition represents U-1 unit. Rhytmically stratified sandy and silty sediments were deposited under changeable conditions. Sandy lithofacies (Sh, Src(T)) were deposited by migration of ripples or transport in near-ground suspension on a dry surface. Deposition of silty lithofacies occurred under windless or low velocity wind conditions (Fm, FSh) and on the wet surface (SFw) as the adhesive ripplemarks (Ruegg, 1983; Schwan, 1988; Lea, 1990). Alternating deposition of sandy and silty lithofacies is the result of seasonal changes: sand – during the autumn/winter; and silt – during spring melt season (Schwan, 1986; Kasse, 2002). Such deposition took place within the aeolian sand sheet on impermeable background (Koster, 1988; Goździk, 2000). Results of OSL dating from U-1 unit (GdTL-4604 and GdTL-4605, with results of 16.5 ± 0.8 ka and 16.7 ± 0.9 ka) suggest that the aeolian sand sheet formed in the final part of the Late Pleniglacial (ca. 16 ka, Fig. 7).
Reduction of available capacity of sandy-silty material and relative improvement of environmental conditions led to initial pedogenic processes and formation of the first soil. Absence of organic material limited possibility of direct dating of such processes. We can assume that the palaeosol formed under harsh conditions between the very end of the Late Pleniglacial and first part of the Late Glacial period. OSL dating result obtained directly from the palaeosol refers to the Bølling interstadial 14.2 ± 0.7 ka (GdTL-4603), but it should be noted that this palaeosol is a natural boundary between aeration and saturation zones of the first ground-water level. We assume that the vertical migration of fine-grained material (particularly clay minerals) and precipitation of Fe–Mn hydro-oxides played an important role. Nevertheless, weak pedogenic processes are visible. Such morphological position of the soil (at the top of aeolian sand cover and beneath the migrating dune foreset) is often for palaeosols of the Bølling age (Kaiser et al., 2009; Moska et al., 2022). The relatively poor soil formation from Bølling interstadial may be due to erosion of its top (humus) layer or to severe waterlogging, resulting from the permafrost still present in the subsoil and reduced water conduction in the ground. This would explain a certain degree of gleyic character of this layer. Stratigraphically, the lowermost palaeosol might be correlated with Lower Loamy Bed known from western part of the ESB, where gleyic phenomena were identified as well (Vandenberghe et al., 2013; Kasse et al., 2018).
The main deposition in the site is represented by U-2 unit. Lithofacies Si formed mainly due to the slide of sand avalanches on the leeward slope of a moving dune. The deflation surface within the unit indicates two stages of the form development. The small lateral extent of the lithofacies and the narrow distribution of structural directions in the bottom part suggest transverse dune migration from NW to SE direction. The larger transverse extent of the lithofacies in the upper part of the unit shows blowing of sedimentary sand across the slope. Such conditions occur on the lee slope of parabolic dune (Hunter and Rubin, 1983; Zieliński, 2016). This interpretation is also indicated by wider spread of directional elements. Such deposition demonstrates the development of parabolic dune, which covered the partially blown existing form, with the predominance of the western wind direction. This palaeotransport direction prevailed in the western and central parts of the ESB throughout the entire Late Glacial (Kasse et al., 2018; Pincé et al., 2022) and is also reported from northern Europe (Alexanderson and Bernhardson, 2019).
The cross-checking of OSL and radiocarbon dating results from the U-2 unit reveals their consistency and correct chronology of depositional processes (Fig. 7). Deposition of migrating dune front was relatively fast and took place in the early phase of the Allerød interstadial (GI-1-c2). Similar results were obtained from the palaeosol complex enriched in charcoals (13 620 ± 80 calBP, GdA-7152). We assume that the charcoals produced by wildfire are more or less synchronous with soil processes on the lee-slope of the dune. The following alternating aeolian sands and palaeosols enriched in charcoals resulted from fires that induced removal of vegetation and reactivation of dune-forming processes (Kappler et al., 2019). At least partial removal of plant cover led to release of exposed sandy material and its deposition on the lee-slope of the dune (Sankey et al., 2009). An intensification of wildfires is noted from the Allerød–Younger Dryas transition in the central-western part of the ESB (Tolksdorf et al., 2014). This is linked to the expansion of Pinus sylvestris in the late part of the Allerød interstadial seen in lacustrine sediment profiles in central Poland and other parts of central and western Europe (Kaiser et al., 2009; Bos et al., 2018; Mirosław-Grabowska et al., 2020).
Radiocarbon dating results allow to estimate chronology of local wildfires. At least four fires took place between 13 620 ± 80 calBP (GdA-7152) and 12 995 ± 70 calBP (GdA-7148). The result obtained from the first palaeosol (13 005 ± 65 calBP, GdA-7147) suggests at least partial redeposition of charcoals. Nevertheless, an increase of fires number is reported also from the central and western parts of the ESB and related to expansion and removal of pine during the Late Glacial climate oscillations, particularly in the Allerød–Younger Dryas transition (Kaiser et al., 2009; van Hoesel et al., 2012). All the radiocarbon results fall within a narrow range of about 600 years on the stratigraphic scale. The vertical succession of the obtained radiocarbon dating results reveals that upper six palaeosols represent the Allerød interstadial (Fig. 7). On the other hand, the luminescence results also position this period in the Allerød interstadial, but due to the resolution of the results (radiocarbon uncertainties are an order of magnitude smaller), it is not possible to create such a precise and detailed chronology. However, it is significant that the obtained OSL results align well with the radiocarbon chronology, which, in our opinion, best reflects the sequence of events over time (Fig. 7). Achieving such radiocarbon chronology was possible due to the use of the best organic material – charcoals.
Vegetation played a crucial role in stabilising dunes, so events like wildfires drastically changed the environmental conditions on dunes. In the Korzeniew site, the fire processes are not correlated with climate deterioration, typical for the Allerød–Younger Dryas threshold (Jankowski, 2012; Hošek et al., 2017). Typically, fires contribute to increased aeolian activity. It may be surprising to observe at least four independent post-fire layers in one location within a period of just 600 years. Fire layers in dunes can provide information about past vegetation types, fuel availability and climatic conditions. Changes in fire activity and frequency over time can reflect shifts in vegetation communities, moisture levels or human influence on the landscape (Dotterweich et al., 2013).
Despite being considered a period of significant climate warming, the Allerød interstadial also had at least two short-lived colder events (Rasmussen et al., 2014). In the case of the described profile, we can clearly state that the Allerød is characterised by the most intense phase of dune formation, shedding new light on the chronostratigraphy of dunes in this area.
The youngest part of the Korzeniew profile can be correlated with the Younger Dryas period, based on the luminescence results 11.6 ± 0.6 ka (GdTL-4593) and 11.8 ± 0.6 ka (GdTL-4594). This aeolian phase also contains material from the fire event described by the radiocarbon result 13,005 ± 65 calBP (GdA-7147.1.1), but in this case, it is much more likely that these charcoals were reworked from the same fire event as the layer below. Therefore, it is easy to explain their significantly older age than the neighbouring luminescence dating results.
. Conclusions
Investigated succession in the Korzeniew site led to reconstructing sedimentary and palaeoenvironmental processes. Such reconstruction is enhanced by cross-checking radiocarbon-OSL dating results. The research carried out revealed that:
Simultaneous using of two independent dating methods and dense sampling is appropriate to construct a detailed chronostratigraphic model.
Successfully reconstructed sequence showing silt-sand aeolian deposition from the very end of the Late Pleniglacial gave way to dune deposition with palaeosols within the Allerød interstadial and Younger Dryas.
Wildfires controlled the development of the vegetation cover on and in the immediate vicinity of the dunes and the activity of aeolian processes.
Despite the relatively warm climatic conditions during the Allerød interstadial, an increased number of fires were observed during this period. This is linked to the expansion of pine trees and their high fire potential.
Short-termed climate oscillations in the Allerød interstadial might have destabilised vegetation conditions and facilitated the development of fires on the one hand and facilitated the re-colonisation of dune areas by plants on the other.