
. Introduction
Radiocarbon dating utilizes two methods to determine the 14C content in a sample: count rate measurement and concentration measurement. The count rate measurement involves the detection and counting of β− particles. This method is used in the gas proportional counting (GPC) technique and the liquid scintillation counting (LSC) technique. In contrast, the concentration measurement method is employed in the accelerator mass spectrometry (AMS) technique.
In the count rate measurement method, one of the sources of uncertainty arises from the presence of other radionuclides in the sample that emit α or β− particles, which can be detected in the 14C counting window. This issue is well known in radiocarbon dating, particularly due to the presence of the radionuclide 222Rn from the uranium series, as documented by Nydal (1983), Polach and Kaihola (1988), Horvatinčić et al. (1995) and Pawlyta et al. (1997). The presence of 222Rn distorts the 14C measurements. Thus far, various approaches have been suggested to address this issue.
. Aging Process
The half-life of 222Rn is relatively short, so the waiting time needed for 7–10 half-lives to elapse is not very long. Based on exponential decay, 222Rn levels can be reduced to background levels over this time period. Therefore, a common method to eliminate 222Rn contamination is the 30-day aging process, in which the sample is stored in a freezer. This method is based on the principle that approximately 99.6% of 222Rn will decay over that time.
. Gas Proportional Counters Methods
Historically, the first methods of 222Rn removal were dedicated to removing radon from CO2, such as by slow fractional distillation at controlled temperatures (de Vries, 1957). There was also the application of gas proportional counters to monitor 222Rn concentration in the Rn–CO2 mixture (Pazdur, 1979).
. Liquid Scintillation Counters Methods
There are several methods of purifying benzene, involving vacuum pumping at low temperatures. Hood et al. (1989) reported that 222Rn can be removed during dynamic vacuum recovery of benzene at −78°C. Tudyka et al. (2021) described a method of removing 222Rn using four freeze–pump–thaw cycles at either −20°C (with a H2O ice and NaCl mixture) or −72°C (with a dry ice and ethanol mixture) to bring 222Rn contamination to the background level.
Another method involves calculating the correction based on additional measurements. This method uses the very short half-life of 214Po, and if two consecutive counts are registered within a certain time window, they can be interpreted as 214Bi and 214Po decays, respectively, referred to as a 214Bi/214Po pair decay event (Theodórsson, 2005b; Tudyka et al., 2015). A liquid scintillation counter with the ability to measure pulse height, pulse shape, and time between subsequent pulses, such as the ICELS system (Theodórsson, 2005a) equipped with a multichannel analyser that records amplitude of pulse and time between pulses (Tudyka and Bluszcz, 2011), or the Multicell spectrometer (Tudyka et al., 2017), is required for this method.
. Mathematical and Computational Methods
The literature lacks mathematical or computational methods that do not require additional measurements or chemical treatment, except for the linear regression fitting method described by Gupta and Polach (1985). By using the radioactive decay equation, one can obtain:
where:– as+b+Rn represents the measured count rate of the sample, background, and radon and its daughter radionuclides present in the sample, obtained from results from the liquid scintillation counter, measured over time t;
– the decay constant λRn = 0.1813 day−1 is known;
– the initial count rate of radon and its daughter radionuclides in sample, aRn0, is unknown;
– the sought-after value is the count rate of the sample and background without radon and daughter nuclides, as+b, which is unknown and constant.
After taking natural logarithm, Eq. (1.1) can be written as
which corresponds to the equation of a line, y = mx + c, where x = t, y = ln (as+b+Rn − as+b), m = − λRn, and c = ln (aRn0). Hence, the values of y are partially known. Gupta and Polach (1985) suggest estimating as+b through ‘guesstimation’ until the slope of the determined curve corresponds to −λRn with an acceptable level.However, this method should be interpreted with caution and can only be used as a means of verifying the presence of 222Rn in the sample. It is not suitable for modern-day processing standards. Firstly, the transformation of data from exponential form to linear form through linearization alters the probability density distribution (Box and Cox, 1964). Secondly, introducing the variable decay constant λ for 222Rn adds an additional degree of freedom to the calculations, which should be avoided.
Therefore, there is a lack of mathematical methods for estimating overcounting induced by daughter isotopes of 222Rn. In this paper, direct exponential fitting is proposed, taking advantage of efficient modern-day numerical calculations.
. Uranium Series Radionuclides
The uranium series, named after its parent isotope 238U, is one of three naturally occurring decay chains. A detailed table of the uranium series, starting from 226Ra (a parent radionuclide of 222Rn) and ending with 210Pb, is presented in Table 1, along with the 14C radionuclide for comparison. Uncertainties are provided in parentheses, and they refer to the last digit or the last two digits of the presented value.
Table 1.
Subsequent decays of the uranium series from 226Ra to 210Pb.
| Parent isotope | Decay mode | Daughter isotope | Percentage of decay mode (%) | Half-life T1/2 | Weighted mean β− decay energy, keV | Q value (max energy), keV | Major decay branches (>0.5%) | ||
|---|---|---|---|---|---|---|---|---|---|
| Mean β−energy, keV | End-point energy, keV | Branching percentages (%) | |||||||
| 14C | β− | 14N | 100 | 5700(30) year | 49.47(10) | 156.475(4) | 49.47(10) | 156.475(4) | 100 |
| 226Ra | α | 222Rn | 100 | 1600(7) year | – | 4870.62(25) | 4601(1) | – | 6.16(3) |
| 4784.34(25) | 93.84(11) | ||||||||
| 222Rn | α | 218Po | 100 | 3.8222(9) day | – | 5590.4(3) | 5489.48(30) | – | 99.920(10) |
| 218Po | α | 214Pb | 99.980(2) | 3.097(12) min | – | 6114.75(9) | 6002.55(10) | – | 99.9789(20) |
| 218Po | β− | 218At | 0.020(2) | 3.097(12) min | – | 259(12) | – | – | – |
| 218At | α | 214Bi | 99.95(5) | 1.27(6) s | – | 6876.1(26) | 6654(5) | – | 6.90(10) |
| 6693(3) | 92.7(5) | ||||||||
| 218At | β− | 218Rn | 0.05(5) | 1.27(6) s | – | 2883(12) | – | – | – |
| 218Rn | α | 214Po | 100 | 33.75(15) ms | – | 7262.5(19) | 7129.1(19) | – | 99.870(4) |
| 214Pb | β− | 214Bi | 100 | 27.06(7) min | 224(5) | 1018(11) | 48.0(32) | 179(11) | 2.75(8) |
| 142.8(37) | 484(11) | 1.063(18) | |||||||
| 205.1(39) | 666(11) | 44.5(7) | |||||||
| 225.3(40) | 723(11) | 39.0(5) | |||||||
| 334.5(42) | 1018(11) | 12.7(9) | |||||||
| 214Bi | β− | 214Po | 99.9790(13) | 19.71(2) min | 641(6) | 3269(11) | 161.4(38) | 540(11) | 0.542(22) |
| 247.8(40) | 787(11) | 1.28(4) | |||||||
| 260.5(41) | 821(11) | 2.78(6) | |||||||
| 317.8(42) | 976(11) | 0.563(16) | |||||||
| 351.8(42) | 1065(11) | 5.56(5) | |||||||
| 356.1(43) | 1076(11) | 0.866(12) | |||||||
| 384.7(43) | 1150(11) | 4.33(4) | |||||||
| 424.2(44) | 1252(11) | 2.459(15) | |||||||
| 426.7(44) | 1258(11) | 1.433(11) | |||||||
| 433.1(44) | 1274(11) | 1.192(21) | |||||||
| 474.5(44) | 1379(11) | 1.589(17) | |||||||
| 491.6(44) | 1422(11) | 8.16(5) | |||||||
| 524.9(43) | 1504(11) | 16.90(11) | |||||||
| 539.0(45) | 1539(11) | 17.55(10) | |||||||
| 566.8(45) | 1608(11) | 0.57(5) | |||||||
| 614.9(46) | 1726(11) | 3.09(4) | |||||||
| 667.6(46) | 1854(11) | 0.90(5) | |||||||
| 683.3(46) | 1891(11) | 7.22(8) | |||||||
| 1007.1(47) | 2660(11) | 0.55(8) | |||||||
| 1268.4(48) | 3269(11) | 19.2(4) | |||||||
| 214Bi | α | 210Tl | 0.0210(13) | 19.9(4) min | – | 5621(3) | 5273(9) | – | 5.8(5) a |
| 5452(3) | 54(4) a | ||||||||
| 5516(3) | 39(3) a | ||||||||
| 214Po | α | 210Pb | 100 | 163.6(3) µs | – | 7833.46(6) | 7686.82(7) | – | 99.9895(6) |
| 210Tl | β− | 210Pb | 100 | 1.30(3) min | 1.18(16)∙103 | 5482(12) | 477(13) | 1380(30) | 2.0(10) |
| 568(14) | 1600(30) | 7.0(20) | |||||||
| 674(10) | 1860(24) | 24(5) | |||||||
| 743(11) | 2020(30) | 10(3) | |||||||
| 877.1(69) | 2413(17) | 10(3) | |||||||
| 1635(18) | 4210(40) | 30(6) | |||||||
| 1762.6(54) | 4386(12) | 20.0(20) | |||||||
| 210Pb | β− | 210Bi | 100 | 22.20(22) year | 6.1(6) | 63.5(5) | 4.16(13) | 17.0(5) | 84(3) |
| 16.16(13) | 63.5(5) | 16(3) | |||||||
| 210Pb | α | 206Hg | 1.9(3)∙10−6 | 22.20(22) year | – | 3792(20) | 3720(20) | – | – |
Within this chain, two isotopes of interest are 226Ra and 222Rn, which can be found in underground water, as well as in drinking water (Cothern and Rebers, 1990) and construction materials of buildings (Nero and Nazaroff, 1984). As a result, these isotopes can be present in the atmosphere of a laboratory and in water used for chemical pretreatment, which can lead to sample contamination.
The first of the aforementioned radionuclides, 226Ra, has a half-life comparable to that of 14C. As such, if it contaminates a sample, it will remain there indefinitely from a radiocarbon dating standpoint.
It is worth noting that the daughter radionuclides of 222Rn, namely 218Po, 214Pb, 214Bi and 214Po, all have very short half-lives of less than an hour. As a result, one decay of 222Rn is followed by four additional decays (Table 1).
The next isotope in the uranium chain, 210Pb, has a relatively long half-life and typically its contribution within the 14C counting window is considered negligible.
The energy of decay is another factor of importance in radiocarbon dating with the LSC technique. 14C decays through β− decay, with a continuous energy spectrum and a weighted mean energy of 49.47(10) keV and a maximum or endpoint energy of 156.475(4) keV. As a result, isotopes that undergo α decay, namely 226Ra, 222Rn, 218Po and 214Po, usually will be separated from the radiocarbon energy spectra (see major decay branches in Table 1).
Isotopes that undergo β− decay, such as 214Pb and 214Bi, have much greater weighted mean β− decay energy that 14C. Therefore, they are mostly separated from the radiocarbon energy spectra. However, statistically some decays will have energy that overlap the 14C energy spectra. The over-counting of uranium series radionuclides in the 14C window is therefore the result of 214Pb and 214Bi decays (other rare decay modes mentioned in Table 1 are negligible).
. METHODS
. Quantulus 1220™ Spectrometer
Quantulus 1220™ is a commonly used ultra-low background spectrometer. Ultra-low level background is obtained by using a passive shield (asymmetrical 630 kg lead shield), active shield (allowing subtraction of scintillations registered simultaneously by photomultipliers in antico-incidence shield filled with mineral oil liquid scintillator and registered by photomultipliers directed onto sample), radio frequency noise discriminator and pulse amplitude comparator (allowing subtraction of pulses whose amplitude is highly different in both photomultipliers directed onto sample; Pawlyta et al., 1997). Measured spectra on the Quantulus 1220™ are spread with logarithmic conversion into 1024 channels (Fig. 1). Hence, radionuclides from uranium series are measured in α/β spectra. The Quantulus 1220™ spectrometer can be used to many experiments such as for determining content of these radionuclides in drinking water (e.g., Schönhofer, 1989; Salonen and Hukkanen, 1997) or for determining 210Pb and 210Po count rates in the sample (Kim et al., 2008).
Fig 1.
Alpha and beta particle spectra of radioactive nuclides in a Quantulus 1220™ liquid scintillation counter with counting windows used at the Gliwice Laboratory (Poland). In most cases, peak from 210Pb would not be observed in radiocarbon dating due to its low probability.
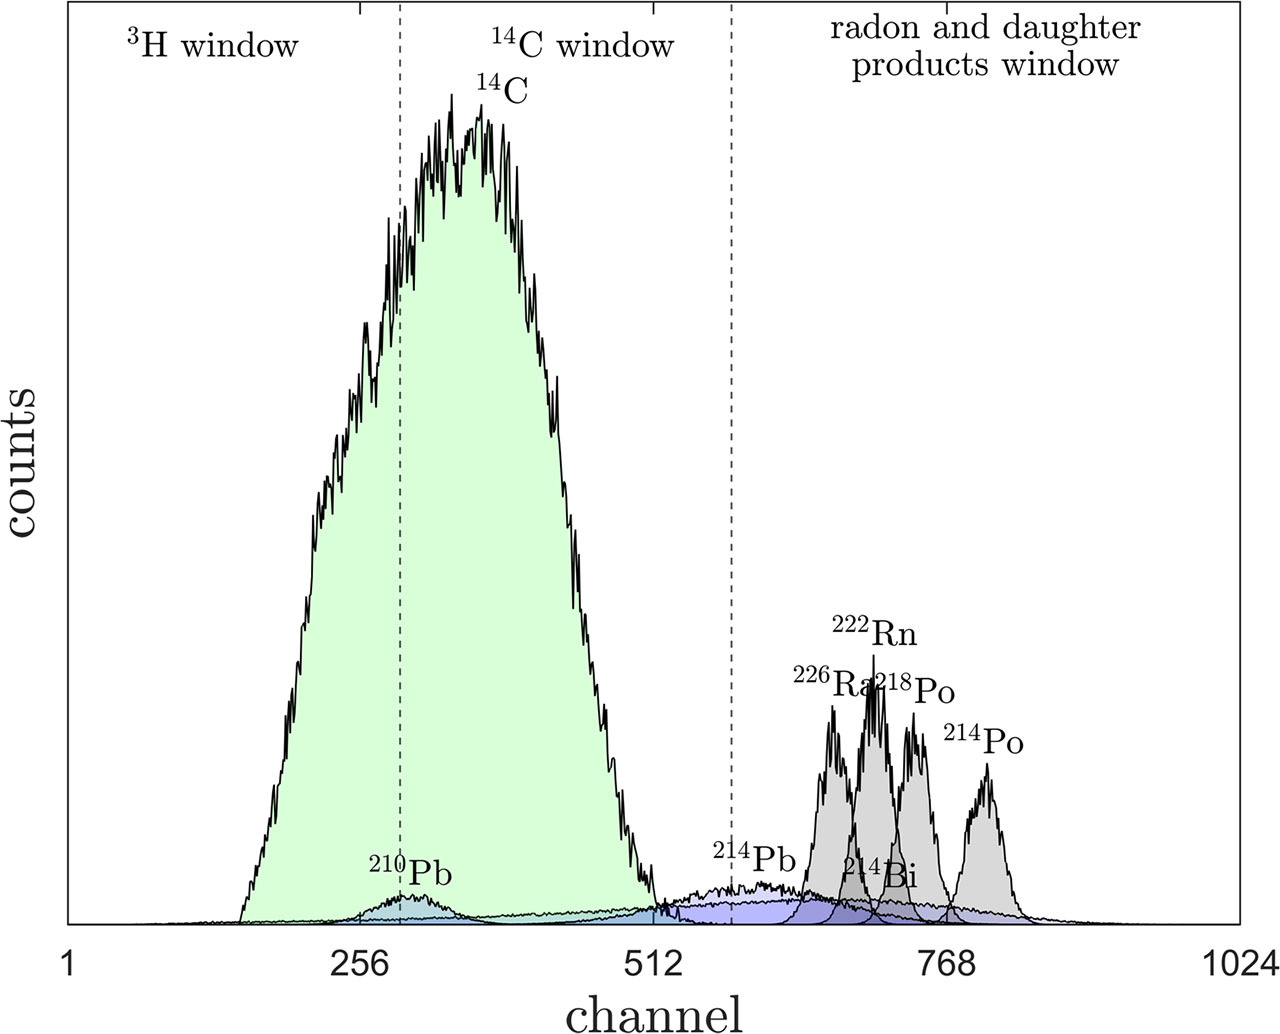
The spectra in the Quantulus 1220™ at the Gliwice Laboratory are divided into three windows, after Tudyka and Pazdur (2010): the 3H window (channels 1–290), the 14C window (channels 291–580) and the radon and daughter products window (channels 580–1024), as shown in Fig. 1.
. Exponential Function Fitting Method
We propose a contemporary approach, distinct from linear regression fitting, which involves direct weighted exponential function fitting utilizing a numerical algorithm to Eq. (1.1).
In most cases, the count rate induced by radon and daughter radionuclides in the 14C window is too small to directly fit an exponential function to the 14C window. However, in the radon and daughter products window, presence of 222Rn and its daughter isotopes is usually noticeable if the sample is measured soon enough after benzene synthesis. Therefore, two fittings into two different windows can be performed using the following formulas:
Here, the C + Rn superscript denotes the combined 14C and radon and daughter products window, and the Rn superscript represents the radon and daughter products window.The radon and daughter nuclides-free count rate in the 14C window is calculated as
This calculation, subtracting two independent values, will be referred to as the subtraction approach later in the paper.
Since some values in Eq. (2.1) are interdependent, a different approach is more suitable, which involves calculating the values in the radon and daughter products window and the combined 14C and radon and daughter products window as a system of equations:
This approach, treating some values as interdependent, will be referred to as the system of equations approach later in the paper. Here, E represents the correction constant, which accounts for the count rate of the radon and daughter radionuclides measured in the 14C window compared to the count rate of the radon and daughter radionuclides measured in the radon and daughter products window. Specifically,
Therefore, if the E constant is determined for the spectrometer, correction in the 14C window can be calculated as:
andThis approach is suitable because most of the time, the overcounting induced by 222Rn and daughter isotopes can be distinguished from the naturally occurring randomness of radioactive decay only in the radon and daughter products window. It is primarily in this window where it is possible to fit an exponential function with statistical parameters at an acceptable level, such as χ2. This attempt, which involves calculating the correction constant, will be referred to as the correction constant approach later in the paper.
. Results
Measurements were performed on the sample of bog wood. Approximately 50 g of material were prepared with the standard ABA pretreatment protocol (after Michczyńska et al., 2018 and references therein). On the next day, benzene synthesis was performed. The sample was pyrolyzed in a cylindrical reactor at 750°C for 15 min with limited oxygen available. To the pyrolyzed sample about 5 g lithium was added, and the reaction was conducted at 700–750°C for 30 min under vacuum, in order to form Li2C2. Upon hydrolysis of the lithium carbide to produce C2H2, trimerization was facilitated by the use of a Cr2O3 catalyst. On the third day, measurements were performed on the Quantulus 1220™ Liquid Scintillation Beta Spectrometer at the Gliwice Laboratory on the 2 mL counting geometry (Pawlyta et al., 1997; Pazdur et al., 2003).
The sample, labelled as GdS-4657, was measured for a longer duration than a typical sample in order to obtain good statistics. Specifically, the sample was measured for 49 cycles, with each cycle consisting of 6 repetitions, and each repetition involving 40 min of measurement. Simultaneously, the background sample was measured for 49 cycles, and each cycle consisted of 2 repetitions, and each repetition consists of 30 min of measurement. For both samples, the SQP(E) parameter was measured after each repetition for 1 min. Thus, the sample was measured for approximately 11 days, which allowed for coverage of almost 3 half-lives of 222Rn.
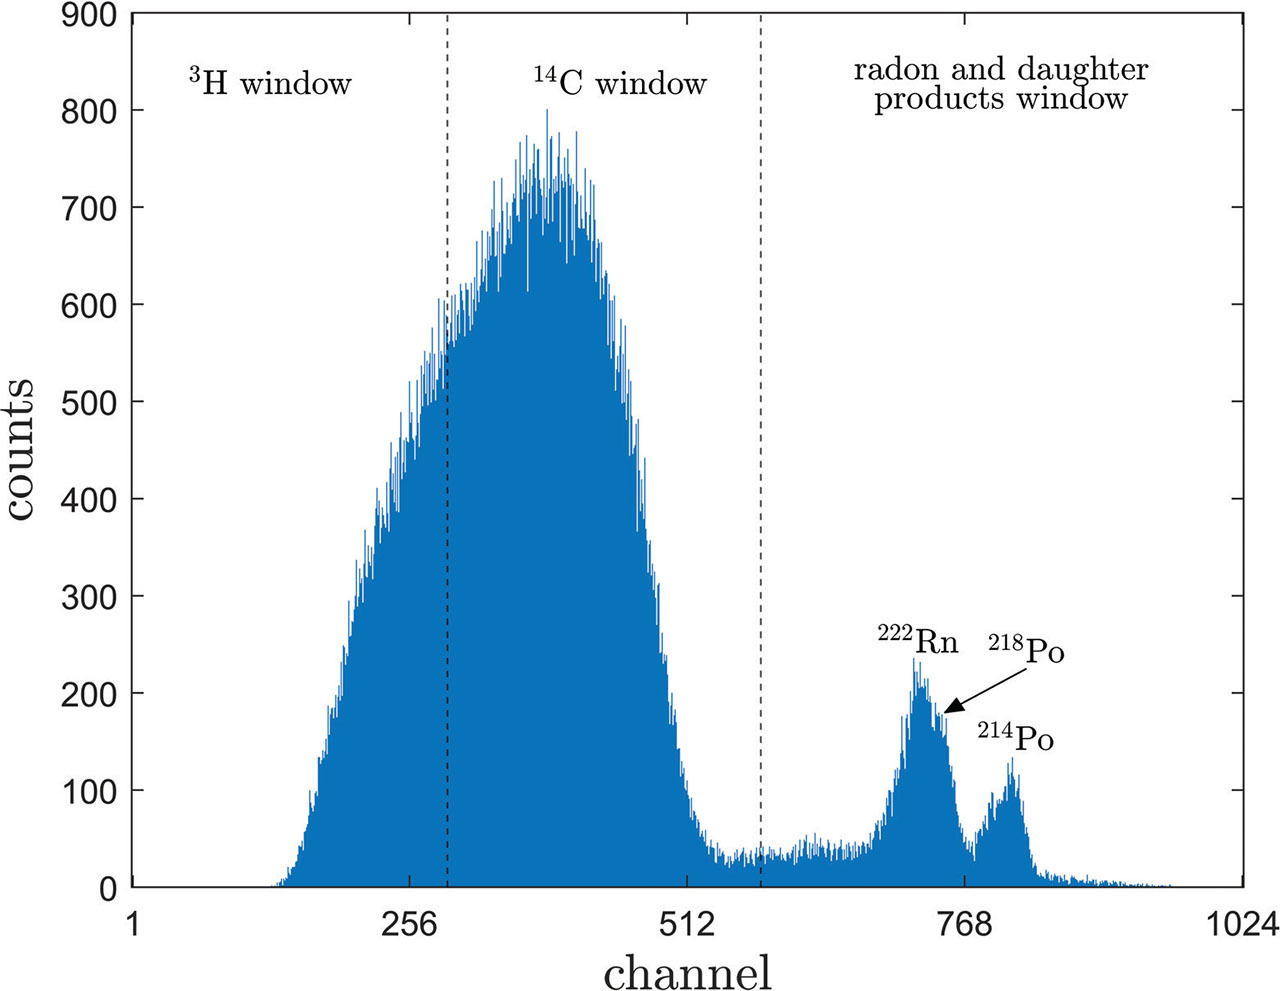
The measured spectra for the GdS-4657 sample clearly show three visible peaks (Fig. 2). The main peak is connected to the 14C decay, while the two smaller peaks are associated with radionuclides undergoing alpha decay. The first smaller peak represents 222Rn and 218Po decays, and the third peak represents 214Po decay.
In a subsequent section of the paper, the count rate is normalized by dividing it by the mass of the sample. This normalization procedure allows us to obtain the count rate per gram of sample. By expressing the results in this manner, we ensure that the count rate values are easily interpretable and comparable, as they are standardized to a consistent unit of measurement.
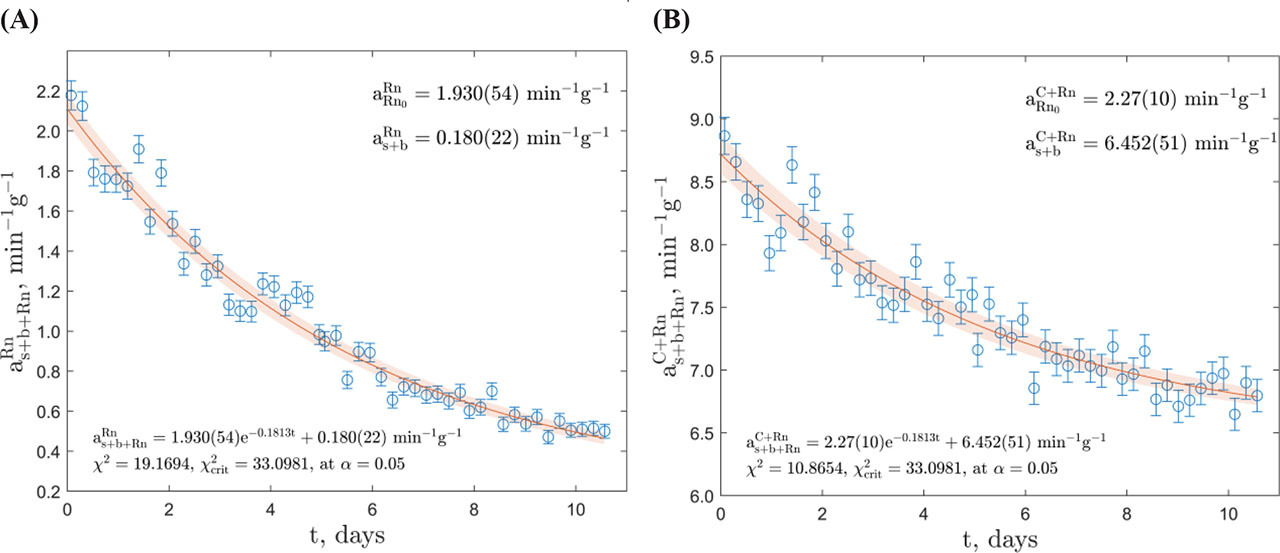
. Subtraction Approach
Calculations were performed using a custom program written in MATLAB® R2022b, employing direct exponential fitting. Fitting was carried out in two separate windows: the radon and daughter products window (channels 580–1024) and the combined 14C and radon and daughter products window (channels 291–1024). Regarding the GdS-4657 sample, the fitted exponential regression exhibited favourable χ2 value in both windows, as depicted in Fig. 3. The count rate
. System of Equations Approach
The second exponential fitting method involving solving of a system of equations was performed in MATLAB® R2022b and also in two separate windows: the radon and daughter products window (channels 580–1024) and the combined 14C and radon and daughter products window (channels 291–1024), as depicted in Fig. 4. Regarding the GdS-4657 sample, the count rate in the 14C window was calculated as
Fig 4.
The results of the solved system of equations for the GdS-4657 sample. (A) – Equation corresponding to the radon and daughter products window. (B) – Equation corresponding to the combined 14C and radon and daughter products window. The fitted functions for both equations are shown with a 68.3% confidence band.
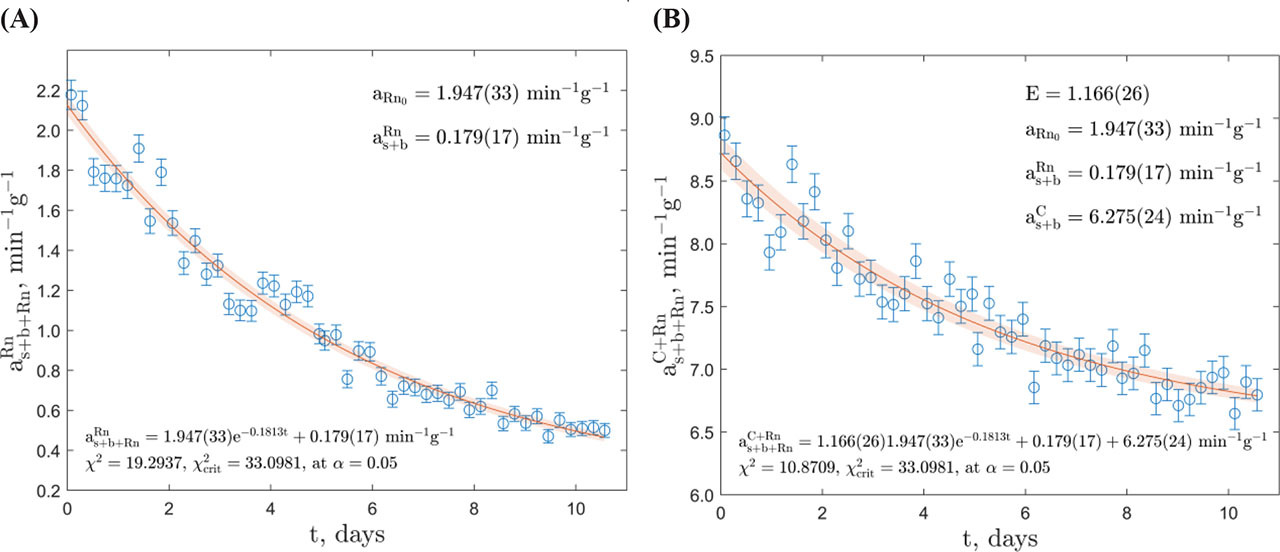
The correction constant E, obtained as 1.166(26), can potentially be utilized in the future to assess the contamination of 222Rn and its daughter isotopes in samples in Gliwice Laboratory. This approach, labelled as the correction constant approach, relies on the definition of the boundary between windows and, consequently, the sample quality parameter (external), abbreviated as SQP(E), which is related to a specific gamma source Compton electrons counts, and quantifies the number of channels above which 1% of the pulses from the external γ radiation source occur, and it corrects for spectral shifts caused by varying levels of quenching in synthesized benzene and instrument gain changes (McCormac, 1992). In order to obtain a comprehensive understanding of the influence of this parameter on the correction constant E, it is necessary to measure it across a larger sample series.
. Dating Results
To assess the efficacy of the method, we performed supplementary measurements on the GdS-4657 sample, which was labelled as GdS-4684 after undergoing an aging process for more than a month, as described earlier. The F14C and 14C age values (Table 2) were calculated by taking into account background correction and the SQP(E) correction.
Table 2.
The measurement results for sample without correction, with both methods of exponential corrections, and after aging process.
Results obtained from both correction methods are in agreement with results obtained for GdS-4684 sample within statistical significance (determined using a t-test). The uncertainty obtained using the system of equations approach is smaller.
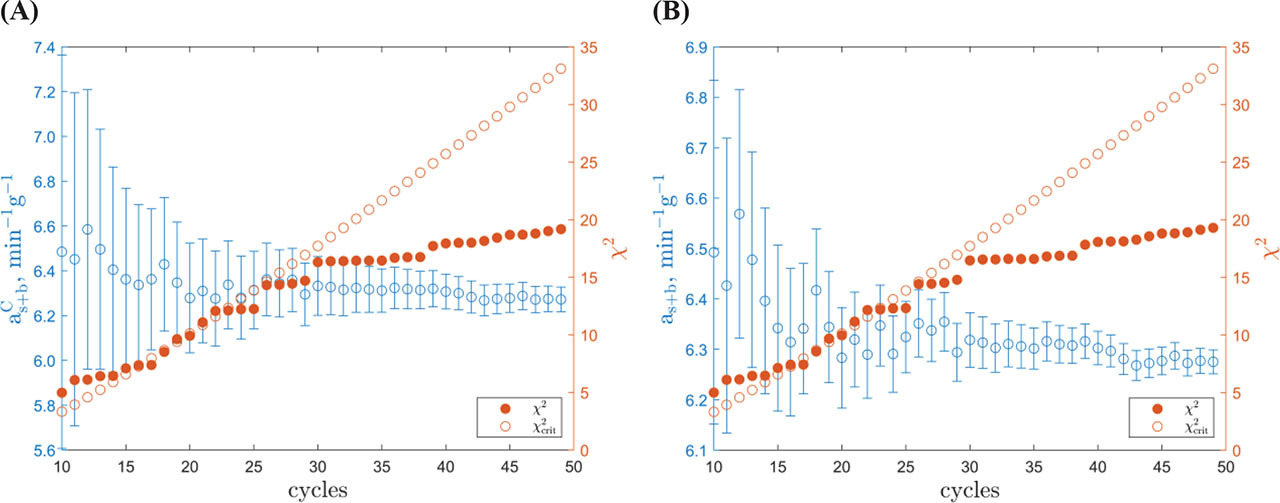
. Required Number of Measurement Cycles
To evaluate the need for extended measurements of the GdS-4657 sample, we analysed the uncertainties in the count rate,
Fig 5.
Evolution of determined count rate, with a χ2 value versus
. Conclusions
The method presented offers the advantage of determining the count rate and 14C age of a sample correction for misestimating resulting from the contamination by 222Rn without the need for additional treatment or electronics during LSC measurements using the Quantulus 1220™ spectrometer. Moreover, the calculations using the described method can be performed in just a few seconds.
However, it is essential to acknowledge the limitations of this method. Firstly, it requires a relatively large number of cycles (35 or more) and a lengthy measurement time in each cycle (around 3–4 h). Consequently, the overall measurement time for a single sample is longer than what is typically used. Furthermore, it is important to note that this method is specifically applicable to freshly prepared benzene samples with a significant level of 222Rn contamination. The count rate within the radon and daughter products window needs to be sufficiently high to overcome the inherent randomness of decay.