
. Introduction
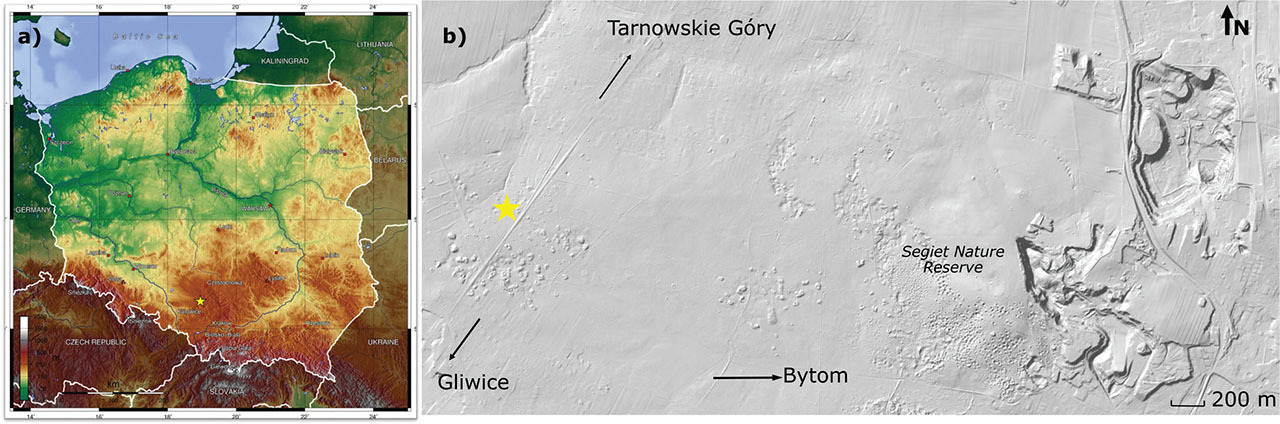
Our study site was located in a post-exploitation field at the border of Bytom and Tarnowskie Góry in Upper Silesia, southern Poland, which features a large number of mining shaft remains of various sizes and relief. The information on the history of mining in this area is limited to historical sources, which indicate that lead ore (galena or lead glance) and silver were mined and smelted in this area from the 12th to 20th centuries (Drabina, 2000). In the late 12th century, an intense mining activity was already in existence near Bytom. Numerous historical evidence of mining in contemporary districts: Radzionków, Bobrowniki Śląskie – Piekary Rudne, Repty, and Tarnowice Stare, not far from the later city of Tarnowskie Góry, have been documented from the years 1229, 1369 and 1449 (Nowak, 1927). The first historical mention of the locality of Repty dates back to the decree of 1201 (ibid.). After the Mongol invasion in 1241, which resulted in a significant depopulation of the country, leaving only a few families in Repty, Duke Władysław granted mining privileges to Repty in order to revitalise the declining mining industry caused by the invasion. In the 16th century, mining in this area was highly intensive, and historical records document that during this period there were years when over 500 shafts were constructed (Nowak, 1927). Unfortunately, detailed historical documents are not always available, and thus it is necessary to determine the age of historical mining remains using absolute chronology methods. Precise dating of these structures allows for drawing conclusions about the development of mining in this area, but in a broader context, it is important for studying the relationship between humans and the environment.
The present study aimed to investigate the historical ore mining remains in Tarnowskie Góry. To achieve this objective, the shafts sediments were investigated using absolute dating methods such as radiocarbon dating and optically stimulated luminescence (OSL). Additionally, the surface layer of the sediment was examined for the presence of fallout radioisotopes, namely 137Cs and 210Pb. Furthermore, the remnants of old construction wood found in the excavation were examined using dendrochronological analysis.
. Study Site
The study site (50°23′56.10″N; 20°18′44.26″E) is located in southern Poland near the Tarnowskie Góry city. This area lies on Tarnowskie Góry Hummock, which is a part of Silesian Upland (Kondracki, 2013). This area has undergone anthropogenic transformations, as mentioned earlier, since the early Middle Ages, and underwent significant intensification by the 16th century. The post-mining area in the vicinity of Tarnowskie Góry has been inscribed on the UNESCO World Heritage List, and LIDAR images reveal over 13,000 objects that are remnants of historical mineral extraction. These objects include remnants of mining shafts, which are generally of small dimensions (2–10 m), although larger structures are also present in the field (11–25 m) (Malik et al., 2022). The area is currently covered with forest vegetation. All three shafts studied in this work are located in the village of Repty (Fig. 1). Moreover, samples were obtained for analysis from the nearby corridor of the old mining excavation, which is located in the surroundings of the Segiet nature reserve.
. Sampling and Methods
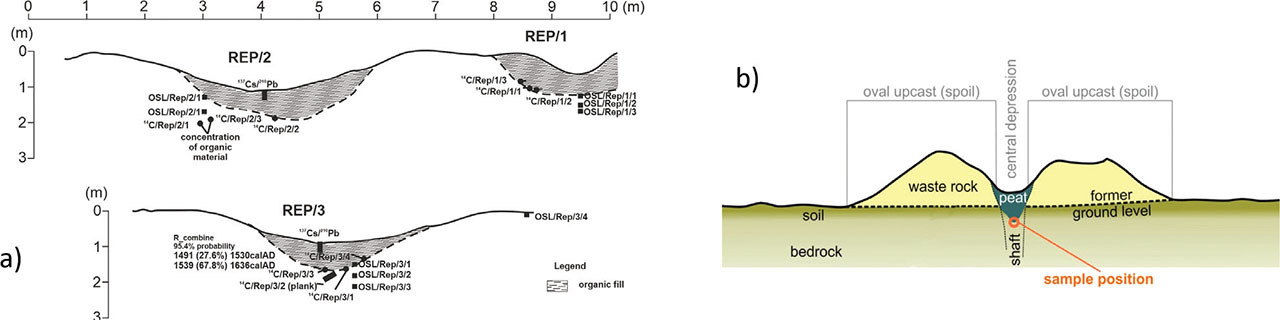
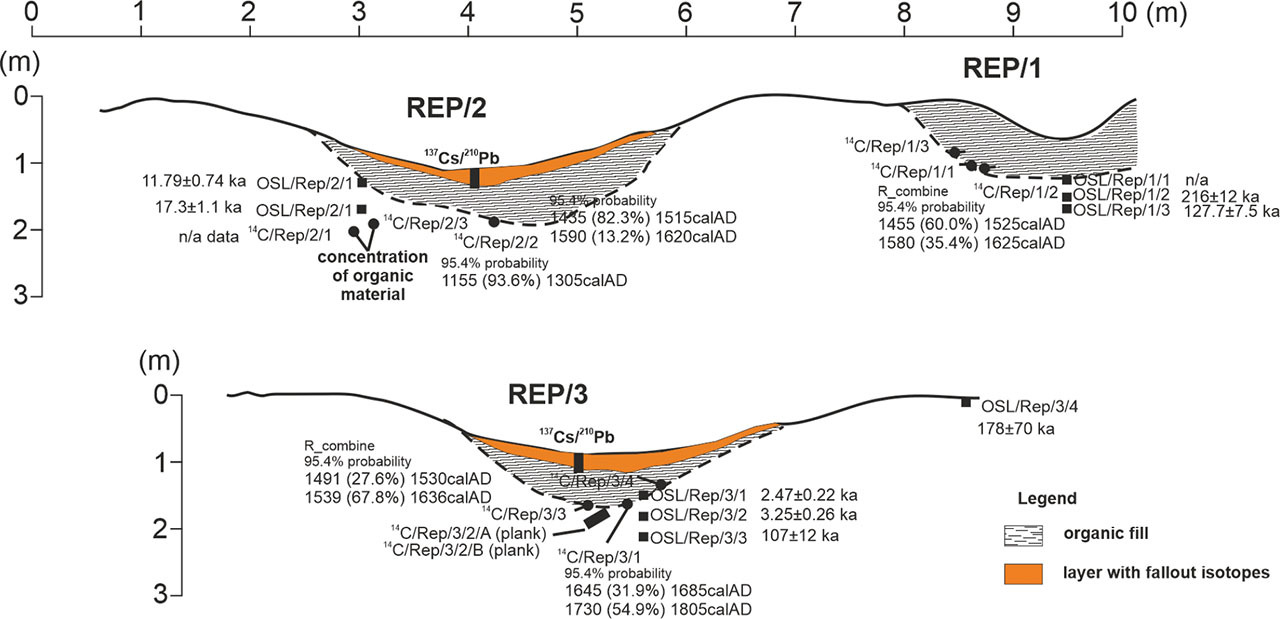
Samples for 14C and OSL dating were collected from three excavations as shown in Fig. 2. The samples were organic or mineral, depending on the method applied. Additionally, we examined two organic samples and one piece of pottery from the underground corridor, as described above. In the REP/3 excavation, striped flints and a wooden plank were also discovered, which were secured for further analysis using radiocarbon dating and dendrochronology.
Fig 2.
A – Three excavation sites, cross sections; B – The scheme of a single shaft. Every shaft consists of an outer part, which is waste rock dug out during ore extraction, and an inner part, which is a depression, filled with organic matter. The sampling position is marked in orange.
. Radiocarbon Dating
A total of 12 samples were taken from the site, 7 of which were sediments containing pieces of charcoal, whereas the remaining 5 were wood. Sediment samples were examined under a microscope to extract possible pieces of charcoal. For samples GdA-6976, GdA-6977 and GdA-6978 it was proved impossible, as the sediment was very dense, and thus the samples were dissolved in ultrapure water and filtered through an 250 μm sieve to extract the charcoal. Samples GdA-6975 and GdA-6976 were both divided into two subsamples, because other organic remains were found in them in addition to charcoal. Those remains, however, were deemed modern, and therefore were not treated further. The charcoal samples were then subjected to an acid–base–acid (ABA) preparation (de Vries and Barendsen, 1954). The first step was acid wash in 0.5 M HCl for 1 h to remove carbonate contaminants, and then they were rinsed with ultrapure water to neutral pH. The next step was alkali wash in 0.1 M NaOH for 1 h for dissolving humic acids and after that the samples were rinsed with ultrapure water again. The last step applied was another acid wash in 0.5 M HCl for 1 h to remove any possible contamination with modern carbon and rinsing with ultrapure water to neutral pH. Next, the samples were dried at 60°C overnight. Acid and alkali washes were performed at temperatures ranging from 75°C to 85°C. After chemical preparation, the samples were weighted in tin boats and subjected to graphite preparation using an AGE-3 system, equipped with an elemental analyser VarioMicroCube by Elementar (Nemec et al., 2010; Wacker et al., 2010). Next, the samples were subjected to Accelerator Mass Spectrometry (AMS) dating.
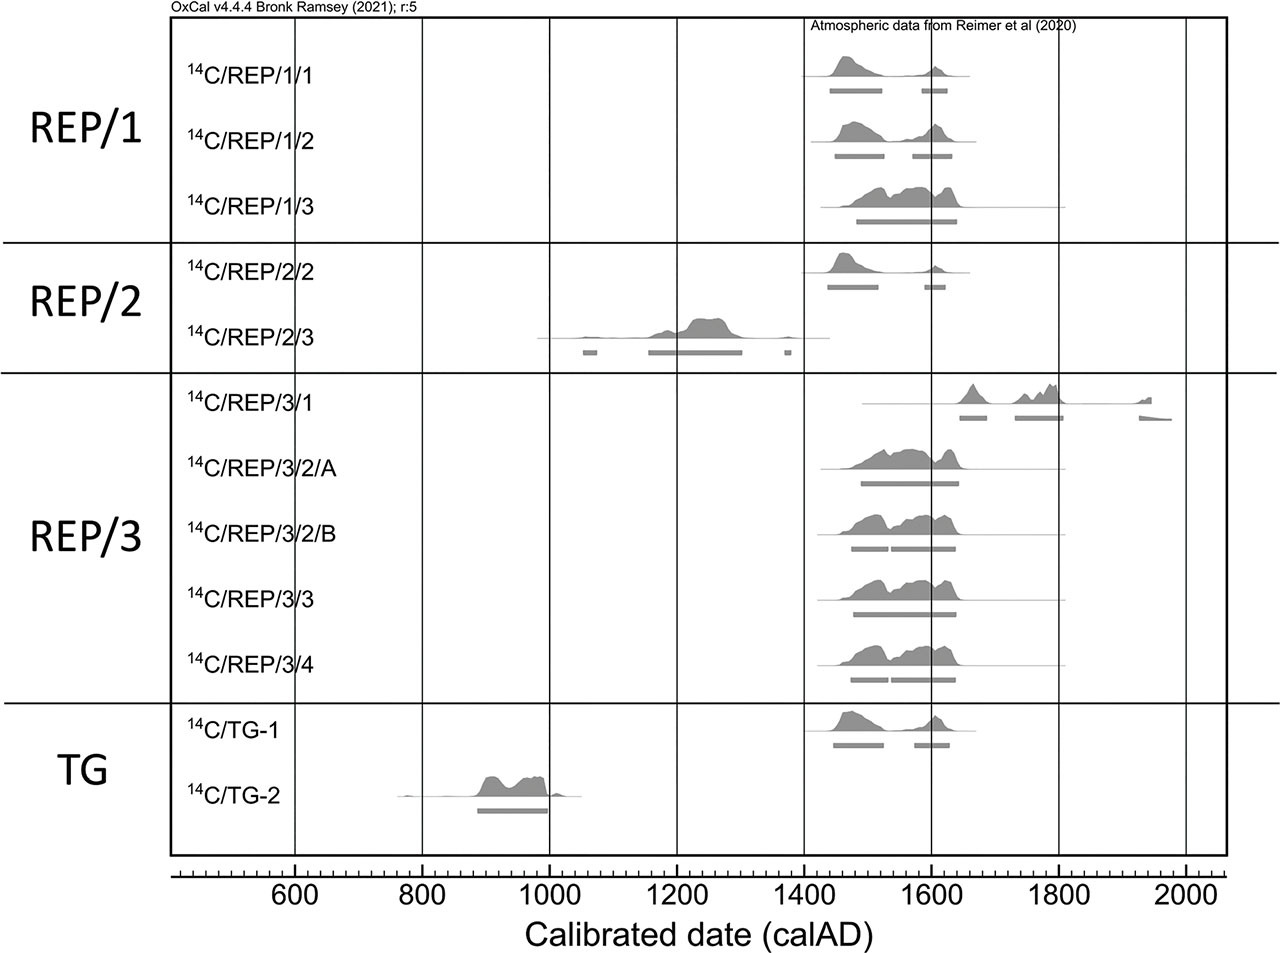
The measurements were performed at the 14C and Mass Spectrometry Laboratory in Gliwice with the AMS system MICADAS (Synal et al., 2007), using oxalic acid (NIST OXA II) for standard normalisation and correction for isotope fractionation and background materials (anthracite, phthalic anhydride and OLGA cellulose) to determine possible contamination introduced during chemical preparation. The results were calibrated using OxCal programme ver. 4.4 (Bronk Ramsey, 2009, 2021) and an IntCal20 calibration curve (Reimer et al., 2020).
. Luminescence Dating
For OSL dating, nine samples from the outcrops of filling of three historical shafts were collected. The samples for OSL dating were collected with the use of steel tubes to protect the samples from sunlight (see Fig. 2). Additionally, the surrounding sediment was collected to measure radioactivity to determine the dose rate.
To determine the age of the collected samples, an OSL was used, which is widely used for various kinds of sediment samples and archaeological artefacts. OSL dating was conducted at the Gliwice Luminescence Laboratory (Moska et al., 2021). The main two parameters required to determine the age of the sample are as follows: Age = De/Dr, where De represents the equivalent dose determined through a luminescence reader, and Dr is the annual dose, which is calculated with the use of radiometric and analytical methods (Tudyka et al., 2018). The research material underwent two independent preparations for measurements to determine the annual and equivalent doses.
Samples for OSL dating were treated with 10% HCl and 10% H2O2 for 48 h to remove carbonates and organic material, respectively. Next, quartz was extracted from the 125–200 μm grain fraction by using density separation (sodium polytungstate). Finally, quartz grains were etched using 40% HF to remove their outer layer (Aitken, 1985, 1998). After etching, they were washed in HCl (20%) to remove any precipitated fluorides. All treatment was conducted under subdued red light. To determine the equivalent dose, a Riso TL/OSL DA-20 reader with a calibrated beta source of 90Sr/90Yr was used. The standard single aliquot regenerative (SAR) procedure (Murray and Wintle, 2000) was employed for the analyses. The final equivalent dose values were calculated for all samples using the Central Age Model (CAM) (Galbraith et al., 1999).
To establish the dose rate, activities of radioisotopes in the samples were measured with the aid of high resolution gamma spectrometry. Before measurement, all samples were dried, homogenised, placed in measurement containers γBEAKER and stored for a minimum of 3 weeks to ensure radioactive equilibrium in U-decay chain (Poręba et al., 2020). An analysis of the activity of radionuclides from the U-decay and Th-decay chains, as well as that of the activity of potassium 40K, was conducted to determine the dose rate of ionising radiation. The spectrometer was calibrated using reference materials provided by the International Atomic Energy Agency (IAEA-RGU-1, IAEA_RGTh-1 and IAEA-RGK-1). Simultaneously, using the HRGS spectrometer, activities of 137Cs and 210Pb were also determined in samples collected from the surface sediment layers. The results of activities of radioisotopes in the sediment were converted into dose rate using the software μRate (Tudyka et al., 2023). The cosmic ray contribution to environmental dose rate for the locations of samples complies with calculations suggested by Prescot and Hutton (1994). For the sample ‘OSL/TG/1’, to obtain the activity of radionuclides due to a small amount of sample, a μDose system was used (Tudyka et al., 2018).
. Other Analyses
In addition to 14C and OSL dating, several other analyses were performed. This included the analysis of 137Cs and 210Pb, dendrochronology for the remains of plank found at the bottom of the filling of shaft number 3, and the archaeological analysis of striped flints found in the fillings of the shaft.
Only one timber sample was available for dendrochronological dating. The board was identified as oak, which is considered a species suitable for dendrochronology; accordingly, standard dendrochronological methods were followed (Baillie, 1982). Tree rings were measured from pith to bark edge using the LINTAB device to a precision of 0.01 mm. For cross-dating, data were processed using the software TSAP (Rinn, 2010), where several common and broadly accepted statistics were used: coefficient of coincidence ‘Gleichläufigkeit’ (Glk), t-value (after Baillie-Pilcher and Holstein) and Cross Date Index (CDI). According to Wigley et al. (1987), no single method is universally superior, especially in relatively short sequences, and a range of methods should be applied for successful dating. Glk is a measure of agreement between the year-to-year variation of two chronologies expressed as a percentage of cases of agreement (Eckstein and Bauch, 1969). TV is a widely known test for correlation significance. We used two types of t-values. The first is the ‘Belfast method’ of statistical cross-dating, which involves computing high-pass-filtered series from raw ring-width data, which are then statistically compared by sliding them against each other at all possible positions satisfying a minimum number of years of overlap criterion (Baillie and Pilcher, 1973) and calculated after detrending to get rid of any age trend that may significantly affect these statistics, as proposed by Holstein (1980). Additionally, we applied the CDI, which includes a combination of Glk and t-values.
The 137Cs (half-life 30.1 years) is a fallout radionuclide that entered the environment as a result of nuclear weapons testing and the Chernobyl nuclear power plant accident. Its presence allows for the study of contemporary geomorphological processes. On the other hand, 210Pb (half-life 22.2 years) is a naturally occurring isotope that is produced through successive radioactive decay in the U-decay chain. The isotope 210Pb is formed as a result of the radioactive decay of 222Rn, which is a daughter product of 226Ra. 210Pb that is produced in situ from 226Ra is referred to as supported, while 210Pb originating from atmospheric fallout is called unsupported (or 210Pbex). The measurement of unsupported 210Pb is widely used to study sediment accumulation rates in various environments. The activity of unsupported 210Pb is typically determined by subtracting the activity of supported 210Pb, which is derived from the daughters of 226Ra, from the total 210Pb content in a given soil or sediment sample (Mabit et al., 2014). Measurements of both radionuclides were performed using gamma ray spectrometry (HRGS), as described in Section 3.2 dealing with luminescence dating. The calculation of 137Cs content was based on the 661.7 keV gamma line. The total activity of 210Pb in the samples was measured at 46.5 keV, and the concentration of the supported 210Pb was determined by measuring short-lived daughters of 226Ra.
The striped flints found in shaft 3 were subjected to archaeological analysis, which did not reveal any evidence of human modification on them.
. Results and Discussion
The results of radiocarbon dating are shown in Table 1. The obtained results mostly fall into the range from the 15th to the 17th centuries (Fig. 3). In one case (GdA-6978.1.1), the sample was slightly younger, around the 17th–18th centuries. Two samples were older – one of them, sampled from the underground corridor, yielded a result indicating a 10th century origin, and the second, sampled from sediments of the shaft REP/2, yielded a result indicating a 13th century origin. The two samples of oak board, namely GdA-6979.1.1 and GdA-6979.2.1, obtained two results that are perfectly matching, with the probability distributions covering the same time interval – from the late 15th century to the middle of 17th century (95.4% probability). Sample GdA-6975.1.1 failed to obtain a result owing to the carbon content being too low.
Table 1.
Results for 14C analysis. Sample information, carbon content, radiocarbon ages and calibrated age ranges (68.3% and 95.4% probability) are provided.
The number of tree rings present on board was 55, a number that allows for dating of oak. To obtain the absolute date, this floating sequence was cross-dated against relevant, local oak tree-ring chronology from Upper Silesia covering the time span 1540–2010 AD (Opała and Mendecki, 2014 and unpublished earlier part of this reference chronology). The oak board was successfully dated by means of dendrochronology, as suggested by positive and statistically significant values of cross-dating (Table 2). However, it is well-known that dates based on short samples should be treated with some scepticism. It was not possible to state unequivocally whether an outermost ring was present. Possible uncertainty may also result from the fact that there were only a small number of samples suitable for dendrochronological dating from the analysed site. Dendrochronological analysis performed for this sample stays in good agreement with the results obtained pursuant to radiocarbon dating, indicating a 17th century origin.
Table 2.
Results of dendrochronological dating of construction wood.
| Date of inner ring | Date of outer ring | Glk | CC | TV | TVB-P | TVH | CDI |
|---|---|---|---|---|---|---|---|
| 1640 | 1695 | 63 | 58 | 5.2 | 3.2 | 3.2 | 20 |
The results of activity of natural isotopes, dose rates, equivalent doses and OSL ages for the collected samples are summarised in Table 3. In the case of OSL age determination, the results of equivalent dose were obtained for 9 out of 10 samples. In the case of sample OSL/1/1 (GdTL-4584), it was not possible to obtain quartz for OSL analysis. Generally, a relatively high variability of dose rates can be observed for the examined samples, which, however, originate from a very small area. The variability of measured contents of uranium and thorium series radionuclides, as well as those of potassium isotope, is also quite significant, which, of course, results in dose rate variability. The obtained results are significantly older than the radiocarbon dates for these fillings and fall within the range of 2.5 ka BP to 216 ka BP. It is highly probable that this is due to incomplete signal bleaching during sediment redeposition. It can be observed that in the case of filling of shaft REP/3, the obtained luminescence dates are the closest to the radiocarbon dates, although even in this case, they are much older than the radiocarbon dates obtained. However, it should be emphasised that the quality of luminescence signal itself is very good. The quality tests demonstrate that the signal quality is more than satisfactory. Even for the oldest samples, the luminescence signal is far from saturation. On the other hand, the obtained OSL dating result for the OSL/TG-1 sample indicates a date range of 1373 to 1573, which correlates much better with the results of radiocarbon analysis. In this case, due to the location of the findings, a significant challenge lies in accurate determination of the dose rate. However, precise determination of the equivalent dose did not pose difficulties in this particular case.
Table 3.
Summarised results of activity concentrations measurement, dose rate calculation, equivalent doses and OSL ages for collected samples. All measured values reported with standard deviation.
| Site | Sample name | Lab code | Depth (cm) | Water cont. (%) | A 238U (Bq·kg−1) | A 232Th (Bq ·kg−1) | A 40K (Bq ·kg−1) | Dr (Gy · kg−1) | De (Gy) | OSL date ± σ (ka)1 |
|---|---|---|---|---|---|---|---|---|---|---|
| REP/1 | OSL/Rep/1/1 | GdTL-4584 | 60 | 13 | 24.5 ± 0.8 | 98.1 ± 1.9 | 74.7 ± 7.6 | 2.362 ± 0.083 | n/a | n/a |
| OSL/Rep/1/2 | GdTL-4585 | 90 | 8 | 14.7 ± 0.5 | 14.2 ± 0.7 | 154 ± 12 | 1.148 ± 0.047 | 247.8 ± 9.6 | 216 ± 12 | |
| OSL/Rep/1/3 | GdTL-4586 | 101 | 23 | 31.8 ± 1.0 | 73.4 ± 1.6 | 305 ± 24 | 2.492 ± 0.087 | 316 ± 15 | 127.7 ± 7.5 | |
| REP/2 | OSL/Rep/2/1 | GdTL-4587 | 54 | 5 | 13.3 ± 0.5 | 16.0 ± 0.5 | 323 ± 25 | 1.724 ± 0.079 | 20.45 ± 0.86 | 11.79 ± 0.74 |
| OSL/Rep/2/2 | GdTL-4588 | 92 | 8 | 7.5 ± 0.3 | 9.0 ± 0.4 | 206 ± 16 | 1.089 ± 0.050 | 18.86 ± 0.74 | 17.3 ± 1.1 | |
| REP/3 | OSL/Rep/3/1 | GdTL-4589 | 45 | 26 | 39.3 ± 1.1 | 49.4 ± 0.8 | 290 ± 22 | 2.196 ± 0.075 | 5.59 ± 0.45 | 2.47 ± 0.22 |
| OSL/Rep/3/2 | GdTL-4590 | 65 | 18 | 39.7 ± 1.2 | 69.2 ± 1.4 | 343 ± 27 | 2.80 ± 0.10 | 9.29 ± 0.64 | 3.25 ± 0.26 | |
| OSL/Rep/3/3 | GdTL-4591 | 110 | 15 | 27.0 ± 0.8 | 43.0 ± 0.9 | 333 ± 26 | 2.237 ± 0.085 | 239 ± 26 | 107 ± 12 | |
| OSL/Rep/3/4 | GdTL-4592 | 30 | 8 | 14.5 ± 0.5 | 16.7 ± 0.5 | 129 ± 10 | 1.132 ± 0.044 | 201 ± 13 | 178 ± 70 | |
| TG | OSL/TG-1 | GdTL-4675 | Corridor | 7 | 59.9 ± 5.8 | 43.8 ± 6.4 | 152 ± 28 | 2.23 ± 0.382 | 1.23 ± 0.01 | 0.55 ± 0.10 |
| 14.29 ± 0.55 | 0.23 ± 0.30 | 4.9 ± 2.8 |
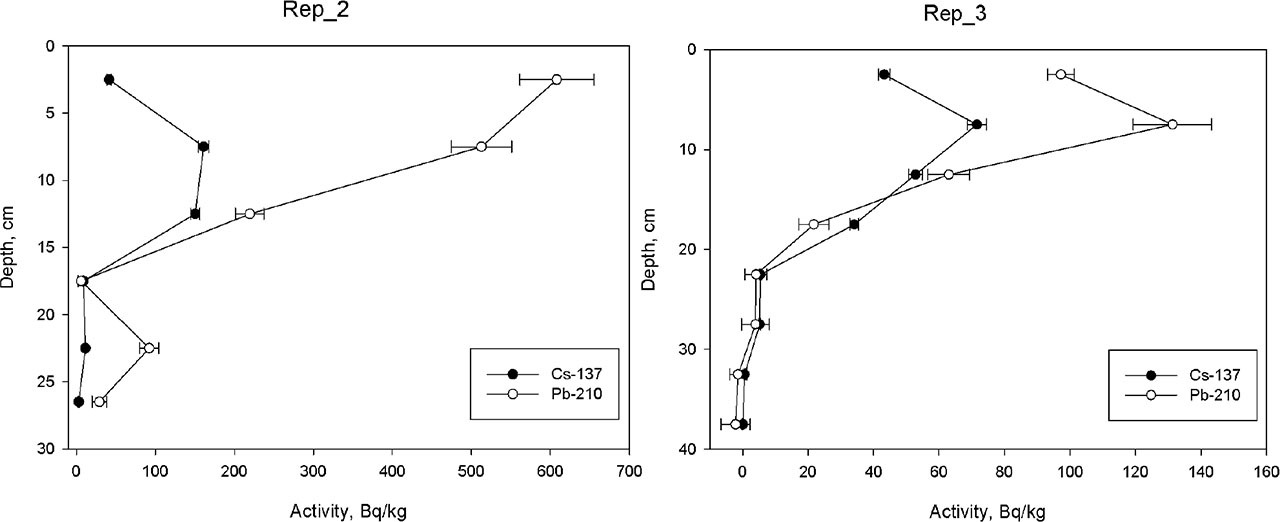
For shafts REP/2 and REP/3, surface material was also collected for 137Cs and 210Pbex activity analysis. Fig. 4 presents the graphs conveying the results of these measurements. In the case of the analysis of the fallout radioisotopes, it can generally be observed that their content decreases significantly with depth, and below 25–30 cm it becomes practically negligible. It is also evident that their activity distribution with depth follows an exponential pattern, which is characteristic of areas that have not undergone mechanical mixing for at least 70 years in the case of 137Cs analysis or even longer if we consider 210Pb distribution. For the distribution of 137Cs, a distinct decrease in its content can be observed in the surface layers.
Fig 4.
The depth distributions of the 137Cs and 210Pbex in the samples collected from the shafts REP/2 and REP/3.
As can be observed in the results, the vast majority of obtained radiocarbon dates fall within a similar range, covering the period of the 15th–17th centuries (see Table 1, Figs. 3 and 5). Additionally, no significant difference can be noticed between most of the radiocarbon dating results of individual samples. Three of the obtained radiocarbon dates deviate from the main range. In one case, the result is slightly younger, ranging from the second half of the 17th century to the 18th century. On the other hand, two dates are slightly older. One of them, obtained from the organic filling, indicates an age reaching back to the 12th century. The other, obtained from the sample taken from the mining corridor, is even older and corresponds to the 10th century. The dendrochronological dating of the discovered remnants of the old construction wood corresponds to the obtained radiocarbon dates. However, as previously indicated, the OSL dates are clearly older, reflecting the redeposition nature of the filling sediments in the shafts. Complementing this, the analysis of fallout radioisotopes suggests the integrity of the upper layers of sediment filling the shafts for at least several past decades, and possibly even longer. Indeed, it is important to emphasise that the analysis of the filling sediments only allows for an estimation of the exploitation age of a given shaft. In reality, the mining activity of the shaft occurred earlier than what radiocarbon dating results would suggest. The organic sediments comprising the filling of the shaft remnants may have accumulated only after the cessation of mining operations in the shafts. In this light, firstly, it is possible that the duration of exploitation for individual shafts was relatively short. This fact, combined with the nature of the radiocarbon dating results, places the main population of results during the period of the greatest mining intensity. Secondly, two older dates suggest that mining activities could have taken place much earlier, possibly as early as the 10th century or even earlier. This is reflected in the available historical documents. However, the question remains open as to whether this exploitation could have started earlier, during the Roman period or even during the Lusatian culture (Malik et al., 2023). The relatively rich material from the Lusatian culture in this area confirms the presence of the settlements from that period (Markiewicz and Tomczak, 2022). Additionally, traces from the Roman period suggest the existence of furnaces during that time (Rozmus, 2023). It is possible that more precise investigations will focus not only on the sediments of the shafts but rather, as well, on the surrounding collars located in the margins of the shafts.
. Conclusions
The results of the research allowed for obtaining information on the age of remains from historical mining in the vicinity of Tarnowskie Góry. In the case of determination of the age using the AMS method, 12 results were obtained for 11 samples, and out of these obtained results, 9 fall within the range of 1435–1645 cal AD, while one age is younger than 1645 cal AD and covers a few age ranges. Two results are significantly older and cover the period of the beginnings of the Polish State. These results cannot be excluded, and it is possible that they refer to attempts of earlier exploitation in the tested area, even entering into the prehistoric period. However, this issue seems to be open and requires further detailed research. The results obtained with the OSL method are significantly overestimated due to poor or lack of bleaching. Future research should cover not only the organic part of the shafts but also the boundary between former ground level and waste rock, as it indicates when the shaft began to be used.