
. Introduction
Industrial or technical carbon black (TCB) is primarily manufactured via incomplete combustion of hydrocarbons, although thermal decomposition in oxygen-deprived conditions can also yield it. The industrial-scale production of TCB involves meticulously controlled processes, employing precise techniques and measurements to ensure distinct properties that differentiate it from soot a contaminated byproduct (Donnet, 2017; Khodabakhshi et al., 2020).
The significance of natural rubber for humans has increased steadily over the past century (Fan et al., 2020). According to the Association of Natural Rubber Producer Countries (ANRPC), the worldwide production and consumption of natural rubber show annual increases of 0.3% and 3.5%, respectively ANRPC. TCB plays a crucial role as a reinforcing filler in tires and rubber goods. Additionally, it finds applications in pigmentation for plastics, printing inks, coatings and other applications aimed at modifying their mechanical, optical and electrical properties. Its incorporation into rubber alters its behaviour, enhancing abrasion resistance, tensile strength, tear resistance and failure characteristics (Kunioka et al., 2014; Donnet, 2017; Robertson and Hardman, 2021).
Over 90% of TCB is composed of pure elemental carbon, where tine and spherical carbon atoms combine to form aggregates. To achieve various property balances, TCBs come in a variety of grades with a wide range of particle sizes, based on surface areas, aggregate morphologies with nanostructures, amount of ash and other compounds (Contec; Robertson and Hardman, 2021). The classification of rubber-grade carbon black (CB) follows the ASTM number system and the four-character nomenclature system. The first character ‘N’ indicates the influence of TCB on the curing rate of typical rubber. The second character indicates the average surface area of the TCB, while the last two characters are arbitrary (ASTM:D1765-17). The most typical TCB with a mean particle surface size is referenced in (Fan et al., 2020).
Globally, approximately 15 million metric tonnes of TCB are produced annually, with about 93% directed to rubber industries. Of this, around 73% is used for tire production, and the remaining 20% in various other rubber appliances. The residual 7% is used for the production of coatings, inks, plastics and paints (Robertson and Hardman, 2021). According to Pehlken and Essadiqi (2005), tires are a complex mixture with a reinforcing agent of CB with silica (ca. 25%) and about 32% of CB can be recovered by tire pyrolysis.
The production of TCB is classified as unsustainable as it utilises non-renewable feedstock, also the production contributes significantly to CO2 emission and energy consumption. As a result, research on green fillers has gained increasing attention, especially for by-products from industrial or agricultural waste and recyclable materials (Fan et al., 2020).
According to Intharapat et al. (2013) and Fan et al. (2020)), the non-biodegradability of petroleum-based CB feedstock can be the cause of serious environmental problems. Various research studies are being performed to transform the dependence of CB feedstock to renewable material resources over fossil fuel. Recyclability, utilisation, low cost and easy availability are the main factors when considering new feedstock. Therefore, CB industries have adopted biobased biodegradable materials as new feed-stock, consisting of natural fibres (from natural resources), sawdust and rice husk (from industrial by-products) and rice husk ash (from industrial waste material). The idea has become more tempting from an ecological or commercial point of view as the use of such kinds of materials can transform the refuse into no damage or even desirable materials.
Radiocarbon analysis can distinguish between fossil and biobased carbon by detecting the 14C/12C isotope ratio within the sample (Haverly et al., 2019; Gill et al., 2022). Fossil materials do not contain 14C isotope after about 50,000 years, as the half-life of the 14C isotope is 5700 ± 30 years (Kutschera, 2019). This research was carried out to verify the renewable material used in the production of TCB samples of different grades, by 14C determination.
There are currently no applicable standards specifying the requirements for a specific amount of biocomponents in TCB. However, the determination of the content of bio-based carbon in various materials can be carried out in accordance with the ASTM D6866 or EN 16640 standard. The EN16640 2017 standard applies in Poland and the measurements were carried out in accordance with it. The samples were analysed by two radiocarbon techniques, liquid scintillation counting (LSC) and accelerator mass spectrometry (AMS), at the Gliwice 14C and Mass Spectrometry Laboratory. Isotope ratio mass spectrometry (IRMS) measurements were used for the isotope fractionation correction.
. Materials
In this study, four TCB samples of varying grades underwent examination. Currently, there are no existing standards specific to TCB samples. Nonetheless, the establishment of such standards is anticipated in the near future given the growing focus on environmental preservation. Manufacturers of CB typically do not disclose information regarding the presence of bioactive materials. However, exploring the viability of using the 14C method to ascertain the modern carbon content holds significance. The samples were sourced from Contec Inc. in Warsaw, Poland, and the details pertaining to each sample are outlined in Table 1.
Table 1.
Details of the TCB samples (Contec; Fan et al., 2020).
. Methods
The samples were prepared and analysed at the Gliwice 14C and Mass Spectrometry Laboratory in the frame of the Institute of Physics – Center for Science and Education, SUT, Poland (Pawlyta et al., 1997; Pazdur et al., 2003; Piotrowska, 2013; Gill et al., 2022).
. 14C Analysis by LSC and δ13C by IRMS
Quantulus 1220TM liquid scintillation β spectrometer, was used for LSC measurements to determine the 14C isotope concentration (Pazdur et al., 2003). Butyl-PBD as scintillator, ANU-Sucrose as standard and Commercial Polish Analar-grade benzene was used as a background for LSC measurements (Pawlyta et al., 1997).
Liquid scintillation spectrometry is used for the β-emitting isotopes such as 14C. In general, for LSC measurements, the sample preparation method passed through sample combustion (organic matter is transformed into CO2) followed by benzene formation with the CO2 and then mixing with a scintillation cocktail (Gill et al., 2022). All chemicals were analytically pure. The samples were directly used for benzene preparation without any chemical pretreatment. The metal reactors were mechanically cleaned, rinsed with deionised water and heated at 700°C in a muffle furnace for some hours. Glassware for the benzene production line was cleaned with ethanol and then with deionised water and dried at 80°C.
TCB samples were directly reacted with lithium metal, in a proportion of 1:1, to obtain lithium carbide (Li2C2) at 700°C of temperature. This reaction took place in a metal reactor for about an hour under controlled pressure conditions. In the next step, Li2C2 is hydrolysed by deionised water to produce acetylene (C2H2), which is purified by a highly hygroscopic mixture of potassium dichromate (K2Cr2O7) and sulphuric acid (H2SO4). C2H2 is trimerised to benzene using a preheated chromium catalyst (at 600°C ~0.5 h). The water molecules from the benzene samples were removed by keeping the sample in sodium metal for 24 h, followed by sublimation. Atmospheric radon was removed by keeping the benzene samples in the refrigerator (at −15°C) for a month, since the half-life of radon is 3.8 days. The complete process for preparing benzene is detailed in (Gill et al., 2022).
IRMS method is applied to calculate the standardised isotope fractionation correction (Stuiver and Polach, 1977; Multiflow, 2012; Agnihotri et al., 2014). It was used for the measurements of the relative ratio of stable carbon isotopes as δ13C (13C/12C). About 5 µL benzene sample (prepared for the purpose of LSC measurement) was combusted with ~300 mg of CuO in Simax tubes at 560°C for ~12 h. CO2 was purified using a dry ice water trap with an ethanol mixture 78°C) and the pure CO2 gas was collected using liquid nitrogen. NBS-22 (oil; ~2 mm), IAEA-CH-6 (formerly, Sucrose ANU; ~3 mg) and WZS (lake sediment, our internal standard; ~2 µg, [Ustrzycka, 2020]) were directly combusted with CuO under same conditions. Standard δ13C values of NBS-22 (oil; δ13C = −30.03‰ (IAEA-NBS), IAEA-CH-6 (formerly, Sucrose ANU; δ13C = −10.45‰; [IAEA-CH-6]) and WZS (lake sediment, δ13C = −5.06‰, [Ustrzycka, 2020]) were used for the correction of δ13C measurements. The IsoPrime 100 spectrometer with a continuous flow regime was used for the δ13C measurements. The spectrometer is connected to the MultiFlow system and the Gilson GX-271 autosampler. MultiFlow is a multipurpose-automated preparation system that is used to carry out online headspace sampling followed by isotope analysis with IsoPrime 100 spectrometer. The system is designed for high-performance analysis, allowing multiple injections of individual samples. The system extracts gas mixtures from the headspace sample vial. The MultiFlow can be used for the measurement of δ13C in CO2. The MultiFlow system is designed to automatically extract and purify the CO2 from a sample and then transfer it to the mass spectrometer. The gas is then sampled with the needle, separated by chromatography and passed to the IsoPrime for isotopic analysis (Multiflow, 2012; Agnihotri et al., 2014). 14C concentrations were corrected for isotope fractionations by using measured δ13C according to Stuiver and Polach (1977) equation:
whereThe uncertainty for δ13C values were calculated as a standard deviation of the mean value of the samples multiplied by the Student-Fisher coefficient.
. 14C Analysis by AMS
The VarioMicroCube Elemental Analyzer coupled with an automated graphitisation equipment (AGE-3) system by IonPlus AG was used for the determination of total carbon content in samples and graphitisation (Němec et al., 2010; Wacker et al., 2010b). MIni CArbon DAting System (MICADAS) accelerator (Synal et al., 2007) and BATS software (Wacker et al., 2010a) were used for the AMS measurements. Oxalic acid (II) was used as a standard, while coal and phthalic anhydride were used to control the background of AMS measurements.
AMS measures the ratios of 14C/12C and 13C/12C precisely. No chemical pretreatments were used for AMS measurements. Approximately 1 mg of the sample was placed in tin boat capsules. The samples underwent combustion in an elemental analyser to generate CO2 gas. This gas was subsequently graphitised using AGE in the presence of H2 and Fe powder (Wacker et al., 2010b). The graphite samples were pressed into target holders (cathodes) at a pressure of 4 bar and sealed with a Cu pin. The 14C concentrations were measured by MICADAS accelerator mass spectrometer (Synal et al., 2007) and BATS software was used for the 14C concentration calculations (Wacker et al., 2010a). Oxalic acid (II), coal and phthalic anhydride were used as the standard and background samples, respectively.
. Results and discussion
The results for the 14C isotope concentration alongside bio-based carbon content according to (EN16640, 2017) from LSC (lab code GdS) and AMS (lab code GdA) laboratories are listed in Table 2. 14C concentrations are reported in per cent modern carbon (pMC) (Stuiver and Polach, 1977). δ13C values are reported in per mil (‰) VPDB and were used for the standardised isotope fractionation correction for LSC measurements. The atmospheric correction factor (REF) in the determined year of 100% bio-based carbon was used to calculate bio-based carbon content, based on data reported by (CIO, 2022; Hua et al., 2021). Bio-based carbon content calculations for TCB samples were performed using REF values for several years and found the highest bio-based carbon fraction with 100 REF values for 2022 (CIO, 2022), listed in Table 2. For AMS measurements, the measured 14C content of TCB was at the same level as background graphites (0.5 pMC for coal and 0.35 pMC for phthalic anhydride), therefore the reported values for TCB were not corrected for background and the calculated bio-based carbon content for these samples would be the upper limit. However, the specificity of LSC measurements requires the subtraction of the background, which largely comes from natural radiation. The average value of background measurements for the measuring device used is 0.3587 pMC with an uncertainty of 0.0037 pMC.
Table 2.
The 14C isotope concentrations are mentioned in pMC for the four different classification categories of TCB samples. δ13C obtained by IRMS (*) and from the AMS measurements (**). The results were corrected for isotope fractionation. The critical χ2 values for confidence level α = 0.01 and four measurements = 11.34, for three measurements = 9.21 and for confidence level α = 0.05 and four measurements = 7.81, for three measurements = 5.99. Bio-based carbon content was calculated according to (EN16640. 2017; CIO, 2022), 100 REF is used for the year 2022 (CIO, 2022).
The 14C isotope concentrations of TCB samples, categorised into four different grades, were measured by LSC and AMS spectrometry. Table 2 presents the 14C concentration obtained via LSC and AMS, the corresponding δ13C values, and bio-based carbon content calculated in accordance with (EN16640, 2017) for each sample. Fig. 1 provides a graphical representation of the 14C concentration values along with their associated uncertainty.
Fig 1.
Comparison between AMS and LSC 14C isotope measurements. ‘•’ AMS measurement results, ‘▪’ LSC measurement results.
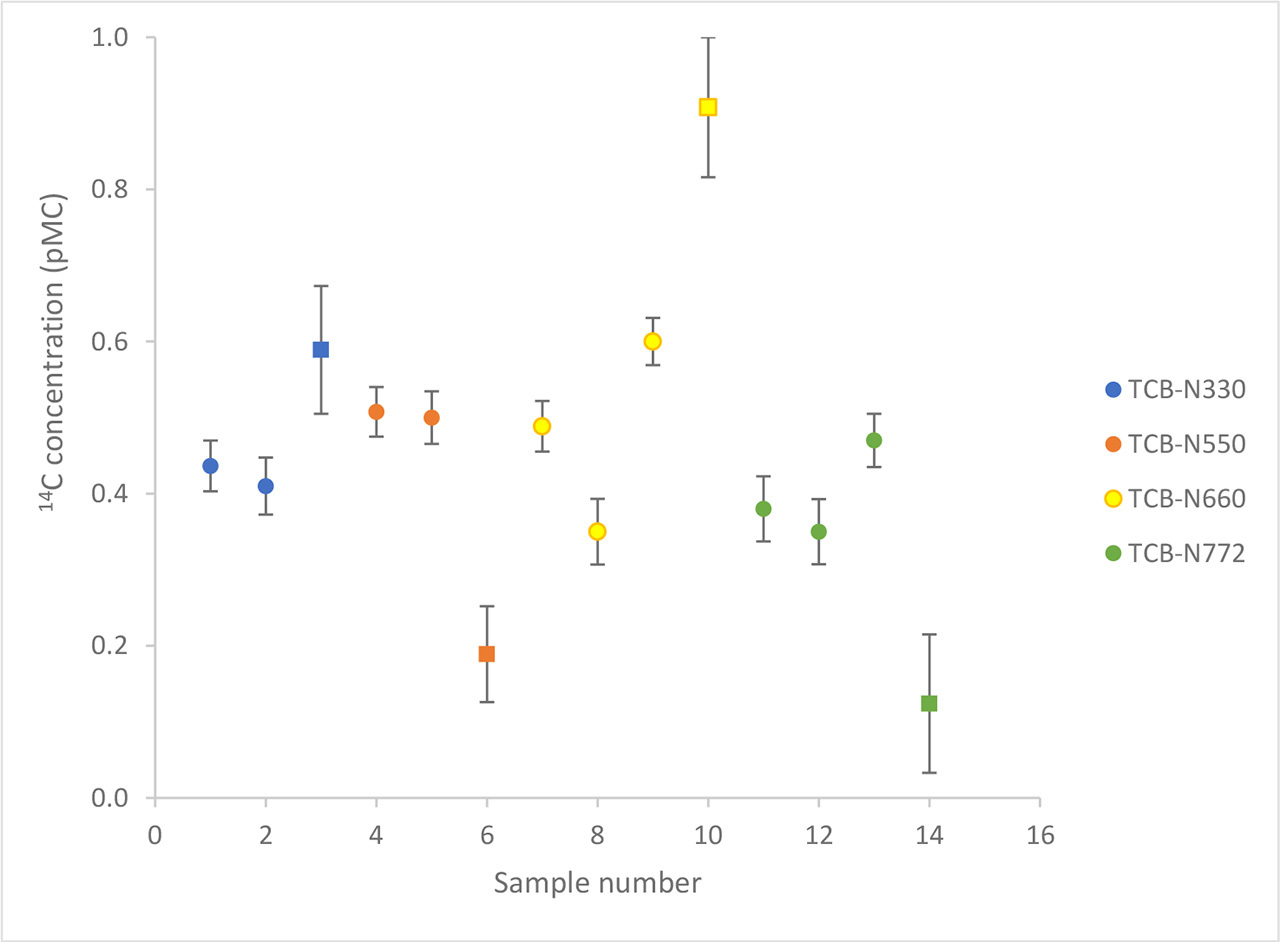
For the TCB-N330 sample, the 14C concentration was measured at 0.436 ± 0.033 pMC and 0.410 ± 0.038 pMC via AMS and 0.589 ± 0.084 pMC via LSC. The AMS and LSC measurements demonstrate agreement.
In the case of the TCB-N550 sample, the 14C concentrations were 0.508 ± 0.033 pMC and 0.500 ± 0.035 pMC from AMS, and 0.189 ± 0.063 pMC from LSC. These results indicate a statistical inconsistency between AMS and LSC measurements.
For the TCB-N660 sample, the 14C concentrations were 0.489 ± 0.033 pMC, 0.350 ± 0.043 pMC and 0.600 ± 0.031 pMC by AMS, and 0.908 ± 0.092 pMC by LSC. The AMS and LSC measurements present statistical inconsistency. The AMS results for this sample demonstrate considerable scatter and do not pass the consistency test.
Regarding the TCB-N772 sample, the 14C concentrations were determined as 0.380 ± 0.043 pMC, 0.350 ± 0.043 pMC and 0.470 ± 0.035 pMC using AMS, and 0.124 ± 0.091 pMC using LSC. Similar to previous cases, the AMS and LSC measurements are statistically inconsistent.
To explain the disparities in measurement results between LSC and AMS, the authors are inclined to support the hypothesis suggesting sample inhomogeneity, which could be because of the ash contamination, the presence of hydrogen atom (provided by the original hydrocarbon feedstock), four-general oxygen-containing chemical groups and sulphur (Contec; Fan et al., 2020). The ASTM D-1506 standard (ASTM:D1506-15, 2020) states that the ash content in TCB should not exceed 1%, but different grades of TCB can vary in ash content within the permissible 1%. Larger particles such as ash could be included more in large samples for LSC than in AMS samples, also the ash content tends to be larger for the samples with lower surface area/mass ratios. This supposition finds potential validation in the scattered AMS measurements for the TCB-N660 sample. Additionally, discrepancies in δ13C values among subsamples of the same TCB, analysed via the AMS technique, lend credence to the notion of heterogeneity within the tested samples. The most notable variations are observed within the TCB-N660 sample.
The results obtained from measurements using two techniques (AMS and LSC) indicate a very low (<1 pMC) concentration of 14C in the tested samples. This suggests a substantial presence of fossil components in samples, indicating their production before the use of biogenic material. The Reference Value (REF) for the year of biomass formation is required to calculate the content of bio-based carbon in the sample (EN16640, 2017). This value corresponds to the 14C activity of pure biomass. The highest bio-based carbon content is determined using the REF value corresponding to the year 2022, set at 100 pMC. Therefore, the bio-based carbon content ratio corresponds to the 14C concentration within the sample. In our previous research (Gill et al., 2022), we measured the 14C isotope concentration in recovered CB samples obtained from the pyrolysis of truck and passenger car tires to be between 5 pMC and 7 pMC (Gill et al., 2022). This variation could be attributed to the conversion of some modern carbon sourced from natural rubber into recovered CB during the pyrolysis process.
. Conclusion
TCB samples underwent analysis in this study. The 14C isotope concentrations were measured in the samples using LSC and AMS radiocarbon techniques at the Gliwice 14C and Mass Spectrometry Laboratory. These TCB samples were sourced from the Contec Inc. Company. According to previous research, the TCB samples were expected to contain a higher concentration of modern carbon. However, all samples exhibited only a minute amount of 14C isotope concentration <1 pMC. The bio-based carbon content mirrors the 14C isotope concentrations of each sample. This study indicates that the four differently graded TCB samples were either not produced from renewable resources or were produced with a minimal share of them.