
. Introduction
Global warming has become an indisputable phenomenon (Marcott et al., 2013). During 1901–2012, the mean global temperature rose by 0.89°C, and the trend of global warming has since strengthened. The average annual surface temperature increase is the strongest in the middle and high latitudes of the Northern Hemisphere; the warmest 30 years of the past 800–1400 years were probably 1983–2012 (IPCC, 2013). This warming trend also has great uncertainty at the regional climate scale, showing a transition of “warm-dry” to “warm-wet” with a double increase in mean temperature and annual total precipitation since the end of the 1980s in Xinjiang, China (Shi et al., 2007). To better predict climate development in the future, it is necessary to understand the changing rules and driving mechanisms of historical climate. However, the limited instrumental data are not enough to study the evolution of the paleoclimate. Tree rings have the characteristics of high resolution, good continuity, wide sample distribution and accurate dating and have been applied in historical climate reconstructions and in studies on the evolution of the paleoenvironment (Cook et al., 2010; Shao et al., 2010; Büntgen et al., 2011; Pederson et al., 2014).
Climate reconstruction based on tree rings is an important method of studying climatology. A large number of studies have been carried out worldwide, mainly in areas of wide distributions of coniferous trees in North America, northern Asia and Western Europe (Briffa et al., 1992; Popa and Kern, 2009; Matskovsky et al., 2017). Much of the climate history has been reconstructed in China, mainly in the northeastern and northwestern regions and on the Tibetan Plateau (Zhang et al., 2011; Zhu et al., 2011; Peng et al., 2013; Yu et al., 2018). The Tianshan Mountains, which are located in the arid and semi-arid inland area of Northwest China, represent an ideal area for the study of dendroclimatology due to its great climatic fluctuations and the highly sensitive coniferous trees (Cheng et al., 2012). A large number of climate reconstructions have been carried out in the Tianshan area since the 1960s and 1970s. Streamflow reconstructions have focused mainly on the central and western regions of the Tianshan Mountains, such as the Manas River, Jinghe River, Urumqi River and Guxiang River (Yuan et al., 2007; Chen and Yuan, 2016; Yang et al., 2016; Zhang et al., 2016). Precipitation reconstructions have been distributed throughout the Tianshan Mountains, especially in the western Tianshan Mountains (Yuan et al., 2001; Shang et al., 2010; Zhang et al., 2013a; Liu et al., 2015; Zhang et al., 2015; Chen et al., 2017). Drought reconstructions have been concentrated in the central and eastern Tianshan Mountains based on the Palmer drought severity index (PDSI), but fewer drought reconstructions have been based on the better Standardized Precipitation Evapotranspiration Index (SPEI) (containing precipitation, temperature, relative humidity, solar radiation, water vapour pressure, and wind speed) (Chen et al., 2013, 2016; Xu et al., 2015a; Xu et al., 2015b; Jiang et al., 2017). Temperature reconstructions have also been studied throughout the Tianshan Mountains, but they have mainly focused on the reconstruction of the mean temperature and the mean maximum temperature; research on the mean minimum temperature is scarce (Chen et al., 2009, 2012a; Chen et al., 2009; Shang et al., 2011; Yu et al., 2013; Zhang et al., 2013b).
Climate reconstruction is based on the ‘uniformitarian principle’, with a stable relationship between tree radial growth and climatic limiting factors (Fritts, 1976). However, some studies have discovered a ‘divergence problem’, with decreasing sensitivity of radial growth to the temperature response in both the middle-high latitudes and the high-altitude regions of the Northern Hemisphere as a result of the strengthening trend of global warming, which has put forward a great challenge to the reconstruction of the historical climate based on tree rings (Briffa et al., 1998; D’Arrigo et al., 2008; Franceschini et al., 2012). Moreover, the results of divergent responses are relatively complex, such as those involving Larix olgensis in the Changbai Mountains in Northeast China, Sabina przewalskii in the northeastern part of the Tibetan Plateau, Sabina przewalskii in the eastern part of the Qilian Mountains and Pinus tabulaeformis in the Helan Mountains in Northwest China, all of which have diverged (Zhang et al., 2009; Shen et al., 2016; Wang et al., 2016). However, Picea crassifolia in the northeastern part of the Tibetan Plateau has a relatively stable response to climate (Zhang and Wilmking, 2010). Studies on divergent responses in the Tianshan Mountains are relatively scarce, but Larix sibirica has an unstable response to climate change in the eastern Tianshan Mountains (Jiao et al., 2015). Therefore, whether Schrenk spruce also results from a divergent response in the western Tianshan Mountains remains to be further tested. Because of the increasing trends in both the mean temperature and total precipitation in the western Tianshan Mountains, historical climate reconstruction based on testing the temporal dynamic stability of the growth-climate relationship would be more accurate. Moreover, climate reconstruction also requires revealing the driving mechanism on a large space-time scale, which is conducive to predicting climate trends in the future. Therefore, the main aims of this paper are as follows: (1) to both determine the main controlling climate factors limiting the radial growth of Schrenk spruce stability of relationship; (2) to reconstruct the mean minimum temperature of the growing season from 1680–2012, and clear rule of climatic change; and (3) to reveal the main driving factors of climate change in the western Tianshan Mountains.
. Material and methods
Study site and sample core acquisition
Samples were collected from the western region of the Tianshan Nature Reserve of Kurdistin in the Tianshan Mountains, Xinjiang, China (Fig. 1). The region has a temperate continental semi-arid climate. The annual average precipitation is 508.3 mm, which is relatively concentrated in the summer (Fig. 2a). The annual mean temperature is 3.4°C, with a mean temperature of –11.2°C in the coldest month (January) and a mean temperature of 15.1°C in the hottest month (July). Schrenk spruce (Picea schrenkiana), which grow naturally at 1500–2800 m above sea level, is one of the dominant tree species in the Tianshan Mountains. The sampling site was labelled as KRD (43°8.914′ N, 82°52.837′ E, 1650–1670 m a.s.l.). To minimize non-climatic effects on tree growth, only trees with no injury and disease in open stands were sampled. In general, two cores were taken from each tree with the borers following the standard methods of tree-ring sampling (Fritts, 1976). A total of 50 cores from 25 living Schrenk spruce trees were selected using 5-mm increment borers in June 2013.
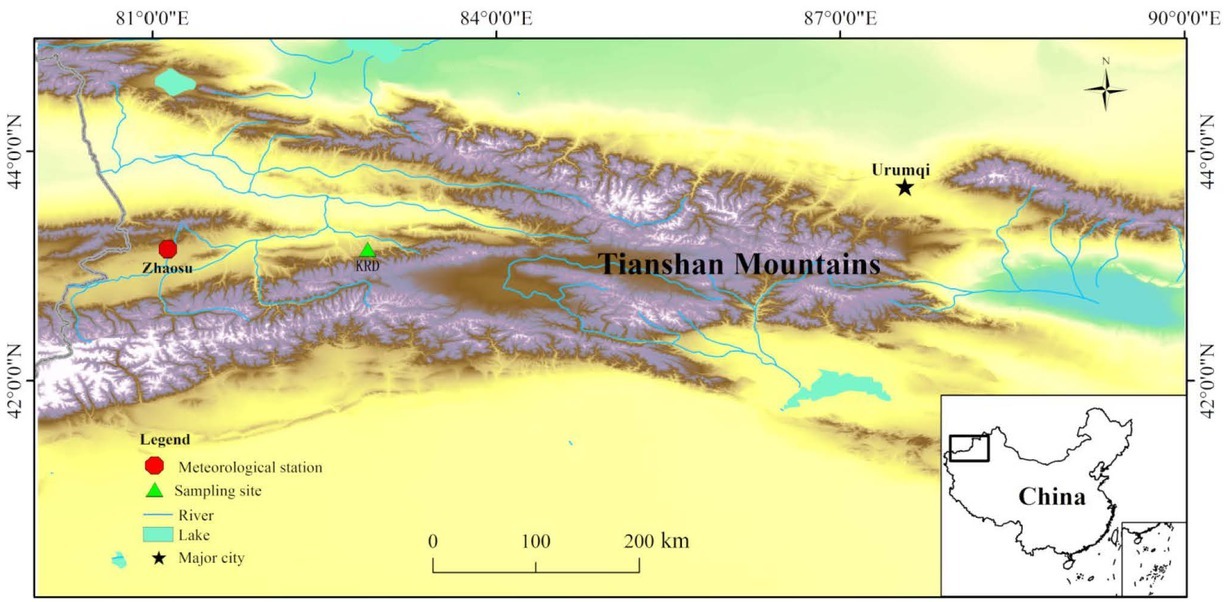
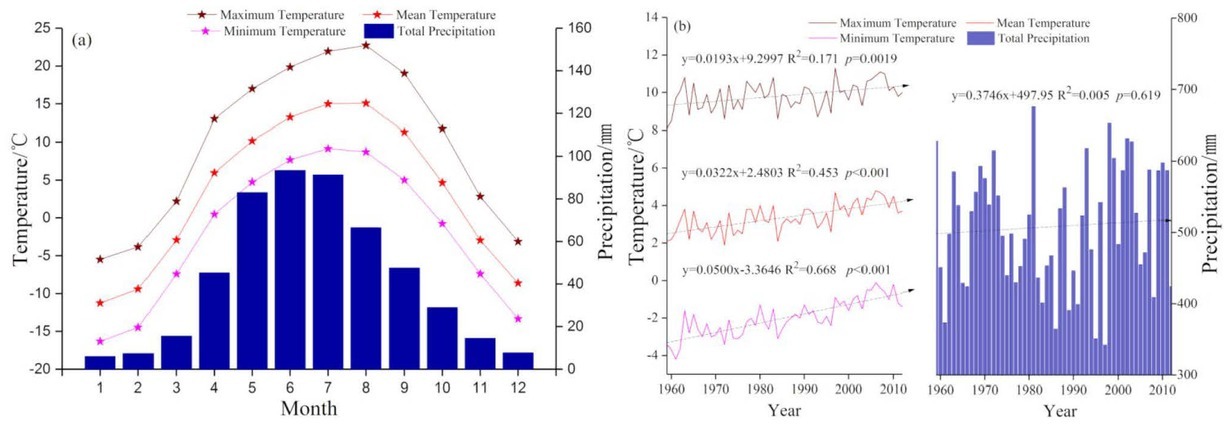
Fig. 2
Temperature and total precipitation during 1959–2012 using records from the Zhaosu meteorological station, Northwest China. (a) Monthly total precipitation and mean, minimum and maximum temperatures averaged; (b) Variation trends of annual total precipitation and mean, minimum and maximum temperatures; the lines with arrows represent the simulated trends by linear regression.
Chronology development
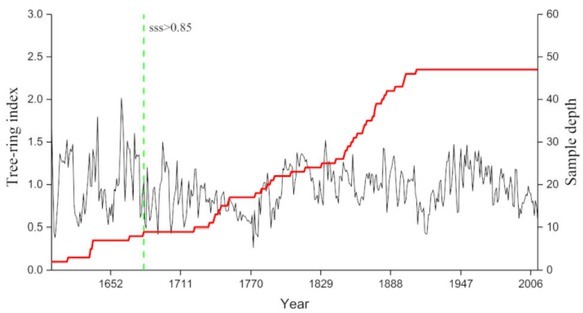
In the laboratory, the tree cores were mounted on woody supports, air dried and sanded to produce clearly visible boundaries for identification, and three cores with ambiguous rings and large growth-curve variations were removed. The rings of the remaining 47 cores were measured with 0.001-mm resolution using the LINTAB measurement system (TM5, Rinntech, Heidelberg, Germany) (Schweingruber, 1996; Stokes and Smiley, 1968). The quality of all measurement series was verified using the COFFECHA program (Holmes, 1983). The measured ring widths were detrended with negative exponential curves or straight lines (Melvin and Briffa, 2008; Cook et al., 2013). A cubic spline with a 50% frequency-response cut-off equal to 67% of the series length was also used in several cases when both types of previous curves failed. All the detrended series were then combined into a composite chronology using a robust (biweight) mean function (Cook and Kairiukstis, 1990). After all these processes, three kinds of chronologies of the KRD sampling site were obtained: standard chronology (STD), residual chronology (RES), and arstan chronology (ARS). The ultimate reliable standard chronology (STD) began in 1680 AD, which was determined based on a subsample signal strength (SSS) value that exceeded 0.85 (Wigley et al., 1984) (Fig. 3).
Meteorological data
The temperature and precipitation data were obtained from Zhaosu (ZS) meteorological stations (43.15° N, 83.13° E, 1854 m a.s.l.) of the National Meteorological Information Center (NMIC) of China near our sampling site (149.3 km) (Fig. 1). The climatic data include monthly maximum, mean and minimum temperatures, total precipitation and SPEI from 1959 to 2012. The SPEI were calculated using R (R Core Team, 2014) with the R package ‘SPEI’ (Beguería and Vicente-Serrano, 2013). The climate data show a significant increasing trend of the annual mean maximum temperature (rising rate: 0.193°C/decade, p = 0.0019), mean temperature (rising rate: 0.322°C/decade, p < 0.001) and mean minimum temperature (rising rate: 0.500°C/decade, p < 0.001); however, the increasing trend of the annual precipitation did not reach a significant level (rising rate: 3.746 mm/decade, p = 0.619) (Fig. 2b).
Statistical methods
In this study, Pearson correlation coefficients were calculated to identify the relationships between tree-ring chronology and the major controlling climate factors. The temporal stability of the growth-climate relationship was tested by a moving correlation function with a 30-year time window using the Dendroclim2002 program (Biondi and Waikul, 2004). A linear regression model was used as a transfer function to derive the reconstruction, and the statistical fidelity of the regression model was validated with split-sample calibration-verification tests (Cook and Kairiukstis, 1990). The statistics calculated for testing the accuracy of the reconstruction include the explained variance (R2), adjusted explained variance (R2adj), F value, sign test (ST), reduction of error (RE) and coefficient of efficiency (CE). RE and CE values greater than zero indicate a good reconstruction model fit. The multi-taper method (MTM) of spectral analysis was applied to examine the characteristics of local climate variability in the frequency domain over the full range of our reconstruction (Mann and Lees, 1996). Our analysis used 5 × 3π tapers and a red noise background. Furthermore, to test whether our reconstruction contains a regional climate signal, we used KNMI Climate Explorer (http://climexp.knmi.nl) to generate correlation fields with synoptic-scale climate parameters, such as the gridded data sets of the Climate Research Unit (CRU) TS 3.24 (Jones and Harris, 2008).
. Results
Relationship between radial growth and climate
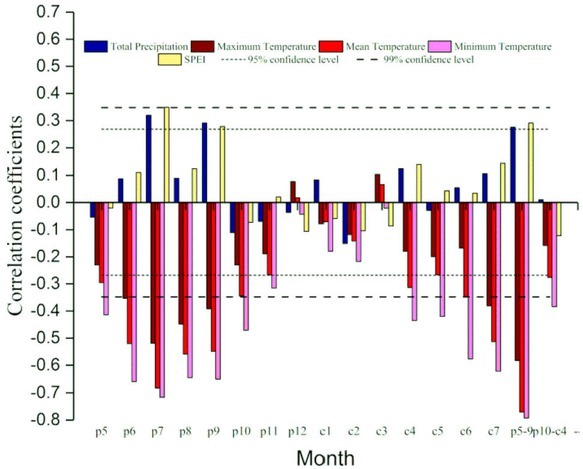
To determine the radial growth and dominant climate factors of trees, we analyzed the relationship between tree-ring width chronology and climate factors via Pearson correlation analysis (Fig. 4). Tree-ring width chronology was significantly positively correlated with total precipitation and SPEI in July (precipitation: r = 0.320, p < 0.05; SPEI: r = 0.349, p < 0.01), September (precipitation: r = 0.291, p < 0.05; SPEI: r = 0.278, p < 0.05) and May to September of the previous growing season (precipitation: r = 0.276, p < 0.05; SPEI: r = 0.291, p < 0.05). The tree-ring width chronology was significantly negatively correlated with the mean temperature in May, June, July, August, September, October, and the growing season, which exhibited the strongest correlation with the mean minimum temperature in the growing season of the previous year (r = –0.792, p < 0.01). Moreover, the first-order-difference correlation coefficient between tree-ring width chronology and the mean minimum temperature was –0.437 (p < 0.01), which shows that the mean minimum temperature was the most important controlling factor for the radial growth of trees in the study region.
Fig. 4
Correlations between tree-ring width chronologies of Schrenk spruce and monthly climate factors (total precipitation as well as mean, minimum and maximum temperatures) during 1960–2012 (the dotted lines represent significance at the 0.05 level, and the straight lines represent significance at the 0.01 level. p: previous year, c: current year, Number: month).
The response stability of the radial growth to the mean minimum temperature was tested via a moving correlation (1959–2012) (Fig. 5). The average value of the moving correlation is –0.403 (p < 0.05), and the temporal dynamics of the response to limiting climate factors were stable (p = 0.5956), which indicated that there is no ‘divergence problem’ and that climate reconstruction could be carried out based on the tree-ring width chronologies of Schrenk spruce.
Fig. 5
Moving correlation results between the tree-ring width chronology and mean minimum temperature. Moving window: 30 years. The grey line represents significance at the 0.05 level. Variation trends of correlation coefficients; the red line with arrow represent the simulated trends by linear regression (1961–2012).

Transfer function and verification
Based on the results of the correlation analysis and moving correlation, we reconstructed the mean minimum temperature in the growing season of the previous year using the standard chronology. A linear regression model was used to describe the relationship between the tree-ring chronology (STD) and mean minimum temperature. The model was designed as follows:
Where Tmin5–9 represents the mean minimum temperature value from May to September at a time scale of 5 months and STD represents the tree-ring index for the next year.
The model explained that the variance of the reconstruction was 62.7% (62% after adjusting for the degrees of freedom) for the calibration period (1959–2012), and the reconstruction series of the mean minimum temperature and observations were significantly correlated (r = 0.792, p < 0.01). Moreover, the first differences in the reconstruction and observations were also significantly correlated (r = 0.43, p < 0. 01), and the value of the F-test was 85.8 (p < 0.01). The results showed a good match between the reconstructed values and the observed values (Fig. 6). The reliability and stability of the model were further validated by split-sample calibration-verification tests, showing that the remaining r, F, and ST tests had reached significance at a 99% confidence level during 1986–2012 (Table 1). The particularly rigorous indicator of the model skill of the RE and CE were both positive, suggesting that the linear regression model was statistically validated and could be used for climate reconstruction.
Fig. 6
Comparison of reconstructed (red line) and observed (blue line) Tmin5–9 data from May to September during 1959–2012 AD.
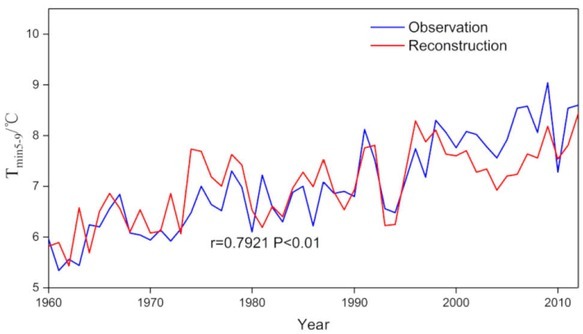
Table 1
Calibration and verification statistics for the Tmin5–9 reconstruction in the western Tianshan Mountains.
Tmin5–9 reconstruction from 1680 to 2012 AD
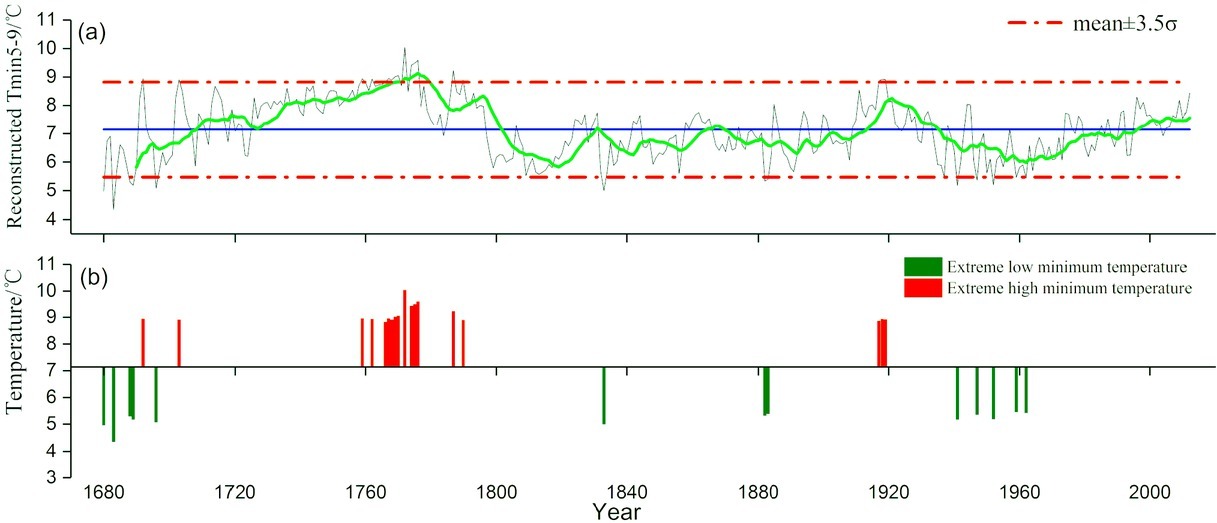
Based on the response analysis and regression model, the Tmin5–9 series of the KRD region during 1680–2012 was rebuilt, which can reflect the interannual variation in the mean minimum temperature (Fig. 7a). Three cooler periods (1680–1707, 1802–1911, 1935–1997) and three warmer periods (1708–1801, 1912–1934, 1998–2012) were found in the past 333 years by the 11-year moving average of Tmin5–9, and there was a clear warming trend (temperature increase: 3.7°C) in the calibration period (Fig. 7a). The average value of Tmin5–9 was 7.00°C, and the standard deviation (σ) was 0.479°C. Thirty-one years of intense change were determined based on the corresponding value > mean + 3.5σ (= 8.68) or < mean – 3.5σ (= 5.33); the number of extreme years smaller than the average was 8, and the number extreme years above the average was 9, which accounted for 47% and 53% of the total extreme years, respectively (Fig. 7b). Moreover, we found that the frequency of the extreme years appeared to be greater under relatively warm conditions.
Fig. 7
The variation in reconstruction (a) and dramatic changes (b) for Tmin5–9 in the KRD region (1680–2012). The green line is the 11-year filtering series.
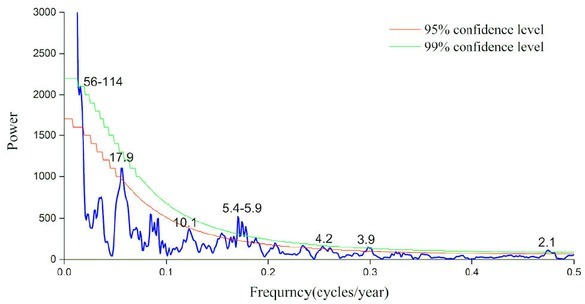
Some significant low-and high-frequency cycles of the reconstruction series of the mean minimum temperature were revealed by the MTM analysis in the growing season of the previous year (Fig. 8). Low-frequency peaks were found at 56–114 yrs (99%), 17.9-yr (95%), 11.3-yr (90%), 10.9-yr (90%) and 10.1-yr (95%). High-frequency peaks were found at 5.4–5.9 yrs (99%), 4.2-yr (99%), 3.9-yr (99%) and 2.1-yr (99%).
. Discussion
Response of the radial growth of trees to climate
Climate reconstruction based on tree-ring enables us to understand not only the changes in the past climate but also the distinct climatic change rules and mechanisms and allows speculation of the trend of future climate development. In this paper, the mean minimum temperature of the growing season of 333 years in the western Tianshan Mountains was rebuilt by the samples of Schrenk spruce tree rings collected in the Western Tianshan National Nature Reserve of Kurdistan, and its variation and driving factors were analyzed.
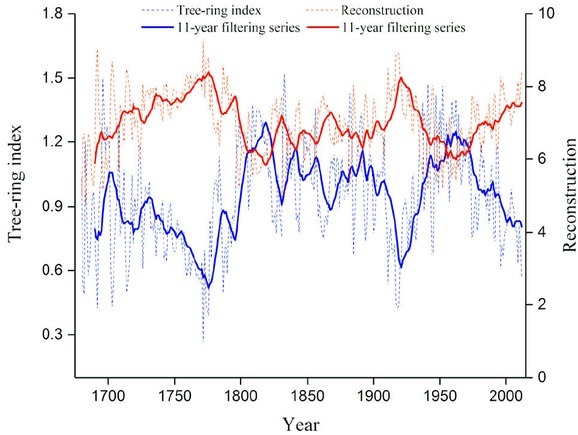
The growth of trees is concentrated mainly in the growing season, so climate change during spring and summer has a great influence on the radial growth of trees (Chen et al., 2009; Peng et al., 2005; Yu et al., 2013; Linderholm et al., 2015; Zhang et al., 2018). Our study also confirmed these results, showing that the radial growth of Schrenk spruce has a significant correlation with the temperature from May to September of the previous year; the strongest correlation was with the mean minimum temperature (r = –0.792, p < 0.01) (Fig. 4). The trend of increasing temperature was caused mainly by a significant increase in the mean minimum temperature in the study, suggesting a greater rising rate of the mean minimum temperature (mean maximum temperature rising rate: 0.193°C/decade; mean temperature rising rate: 0.322°C/decade). Therefore, the mean minimum temperature increase was also recorded in the radial growth of Schrenk spruce (Fig. 2b). On the one hand, many terrestrial biogeochemical processes of plants are regulated by the mean minimum temperature, such as plant respiration, plant productivity, plant nutrient uptake and so on (Palombo et al., 2014). With the increase in mean minimum temperature, the nutrient consumption of tree respiration increases, which negatively affects radial growth and forms a narrow ring (Yu et al., 2013). Cellular growth in plants is believed to occur mainly in the evening, and the mean minimum temperature is the dominant factor that restricts cellular production rates and controls the length of the growing period by acting on tissue formation (Li et al., 2013). On the other hand, the increase in temperature can also increase the evapotranspiration of soil water, and it is particularly easy to cause the shallow-rooted Schrenk spruce to be affected by water deficit. Meanwhile, we also found that the tree-ring width chronology was significantly correlated to the SPEI of May to September in the previous year (r = 0.291, p < 0.05), which also proved the effect of drought on the radial growth of trees. For example, the growth rate of Schrenk spruce on a steep slope in the eastern and western Tianshan Mountains would decline rapidly in the face of long-term drought due to its shallow root system (Wu et al., 2013; Jiao et al., 2017). Moreover, the response of trees to climate factors has lagged effect, showing that the accumulation of photosynthetic nutrients in the previous year has a significant effect on tree growth in the current year. Pinus sylvestris in northern Inner Mongolia and Sabina przewalskii in both the northwestern Qilian Mountains and the northeastern region of the Qaidam basin are both limited by climatic factors of the previous year (Shao et al., 2005; Liu et al., 2009; Yang et al., 2011; Chen et al., 2012a). In our study regions, similar results were also found, in that the radial growth of trees was negatively correlated with the mean minimum temperature in the growing season of the previous year. The degree of narrow rings would increase as the temperature continues to rise in the future (Fig. 9).
Fig. 9
The relationship between the tree-ring index (blue dotted line) and the main controlled climate factor (red dotted line). The thick line is the 11-year filtering series.
Tree rings are important substitute materials for paleoclimate reconstruction, which has been confirmed in a large number of studies on tree-ring climatology (White et al., 2014; Jiao et al., 2016; Ponocna et al., 2016; Jiang et al., 2017). However, divergent phenomena have taken place with global warming, and dynamic responses have a great impact on the accuracy of the results of climate reconstruction based on tree rings (D’Arrigo et al., 2008; White et al., 2014; Jiao et al., 2015; Shen et al., 2016). Therefore, it is necessary to test the stability between radial growth and the main limiting climatic factors before climate reconstruction. There was no divergent response, and the response of Schrenk spruce to the climate factors was stable based on examination of the dynamic growth-climate relationship. Reconstruction results by divergent tests were relatively more reliable during the past 500 years of precipitation reconstruction in the southern part of Germany based on Picea abies and Abies alba (Wilson and Elling, 2004).
Reconstruction of the spatial representation and regional comparison of the mean minimum temperature series
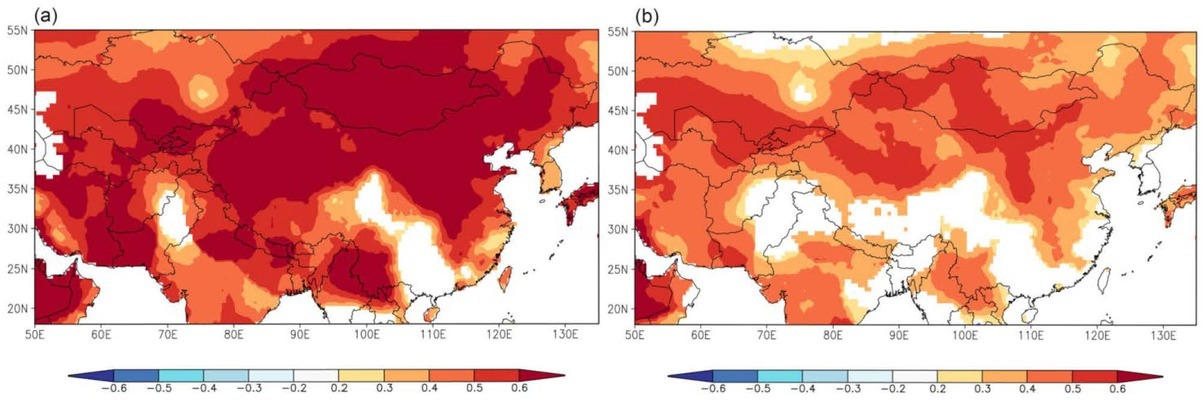
To understand the spatial representation of the reconstruction results, the correlation coefficients were calculated between the measured values and reconstruction values of the mean minimum temperature and the regional CRU lattice from 1959–2012 (Fig. 10). Both the measured values and reconstruction values were significantly positively correlated with most regions in central Asia. Therefore, the temperature signal in the study regions can be captured based on the mean minimum temperature of the reconstruction of Schrenk spruce, and it can represent the temperature change characteristics in larger regions.
Fig. 10
Spatial correlation patterns between regional Tmin data (CRU self-calibrating Tmin of 3.21) and the data of observed Tmin (a) and reconstructed Tmin5–9 (b) from1959–2012.
To further verify the reliability of the results, the reconstruction series were compared with other reconstruction series near the study regions. Our reconstruction series significantly correlated with the mean minimum temperature series of Gongnaisi (r = 0.108, p < 0.05, 1680–2008) and Shawan (r = 0.162, p < 0.01, 1680–2001), and PDSI series (r = –0.307, p < 0.01, 1680–2008) in Tianshan Mountains. Especially, there is consistency between our reconstruction series and both the mean minimum temperature of May to August in Gongnaisi during the summer and the mean minimum temperature of June to August in Shawan, Xinjiang, during 1708–1765, 1820–1854, 1945–1976, and 1998–2008 (Yu et al., 2012, 2013). The warm and cold periods of our reconstruction series were also the same as the mean maximum temperatures of June to August in Yili, Xinjiang (the warm period during 1708–1732, 1756–1774, 1794–1801, and 1909–1932 and the cold period during 1682–1616, 1828–1844, 1870–1908, 1935–1943, and 1949–1972) (Fan et al., 2008). In comparison with the spring drought in the Tianshan Mountains, the wet and dry period coincided with the our cool and warm period of reconstruction during 1680–1692, 1842–1857, 1875–1908, 1933–
1938, 1957–1974 and 1708–1722, 1758–1790, 1908–1934 (Zhang et al., 2017). These results all indicated the accuracy of our reconstruction of the mean minimum temperature in the growing season from another aspect.
In addition, the reconstruction results were compared with the drought events recorded in the historical documents of Xinjiang regions and the volcanic eruption years by high/low mean percentage, it is the reconstructed value minus the reconstructed average divided by the reconstructed average. (Wen et al., 2006; Chen et al., 2012a). The mean minimum temperature reconstruction had a good correspondence with the drought events in the Xinjiang region, and the values of the drought events were significantly higher than the average reconstructed temperatures, especially in some extreme drought years, such as 1775, 1919, and 1945 (Chen et al., 2013; Liu et al., 2013; Zhang et al., 2017). Radial growth of trees is also responsive to volcanic eruptions and temperature changes had been importantly affected by many upper westerly circulation and low latitude tropics massive volcanic eruptions in central Asia (Chen et al., 2012b). After the eruption, the width of the growth-rings increased due to reduced temperature and intensified precipitation. Therefore, it was found that the temperature in the year of volcanic eruptions was obviously lower than the average value of the reconstructed temperature (Table 2).
Table 2
The dry and volcanic years recorded in historical documents (high/low mean percentage were calculated with the reconstructed value minus the reconstructed average divided by the reconstructed average).
Relationship between reconstruction results and external environmental factors
Regional climate change is affected by large-scale climate-forcing factors, such as solar activity and atmospheric–oceanic variability (Fang et al., 2010; Linderholm et al., 2015; Rydval et al., 2017).
On the one hand, based on the MTM analysis results, the temperature changes in the study area are mainly influenced by the solar activity via the mean minimum temperature within approximately 11-year periods (Li et al., 2006; Wang et al., 2015). The cycle similarity of the reconstruction values with the North Atlantic Oscillation Index (NAO) indicated that the climate might be affected by the NAO in the study regions: the values included 2.06 (2.07), 3.90 (3.91), 3.96 (3.95), 5.44 (5.43), 5.56 (5.57), 64.10 (63.69), 72.99 (72.99), 102.04 (102.04) and 113.64 (113.64), respectively. The climate is influenced mainly by the westerly circulations in the Tianshan Mountains, showing that the warm wet air in the Atlantic Ocean enters the Xinjiang regions driven by the westerly wind circulations and affects the trees in the Yili Valley and the western Tianshan Mountains. Moreover, the temperature changes in the cycle in the range of 5.4–5.9 and 3.9 years might be affected by the El Niño-Southern Oscillation (ENSO), and in the range of approximately 2.1 years, these changes might be related to tropical biennial oscillation (TBO) (Allan et al., 1996).
On the other hand, regarding the spatial correlations between the reconstruction values and the global sea surface temperature (SSTs) in May to September, the reconstruction was strongly correlated with the northern Atlantic, western Pacific and Indian Oceans (Fig. 11). Fig. 12a shows that the reconstruction values were significantly correlated with the North Atlantic Oscillation Index in the summer (SNAO, Folland et al., 2009), with the high-frequency change in March to September (r = 0.221, p < 0.05, 1930–2012) and the low-frequency change occurring with the 5-year moving average (r = 0.366, p < 0.01, 1930–2012). The same conclusion has been found in the reconstruction of precipitation over the last 300 years in the west-central Tianshan Mountains, the reconstruction of drought in the past 364 years in the central and western Tianshan Mountains, and the streamflow reconstruction of the eastern Tianshan Mountains over the past 330 years (Wang et al., 2015; Chen and Yuan, 2016; Zhang et al., 2017). The reconstruction results were correlated with the Western Pacific Oscillation Index (WPO, https://crudata.uea.ac.uk/cru/data/wpo/), with the high-frequency change in April to August (r = 0.331, p < 0.01, 1950–2012) and the low-frequency change occurring with the 5-year moving average (r = 0.528, p < 0.01,
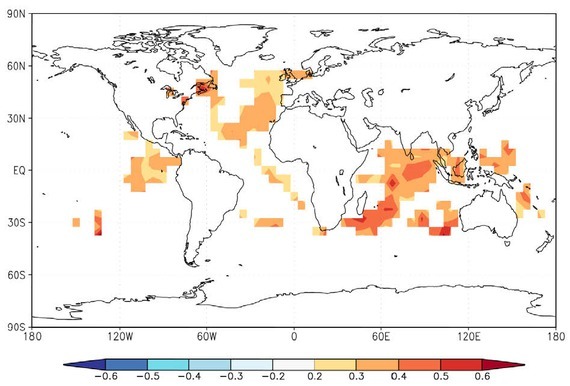
Fig. 12
Comparison of correlations between reconstructed Tmin5–9 (red line) and SNAO (a) in March to September (blue line) and WPO (b) in August to September (blue line). The gray area represents the consistency of fluctuations between series.
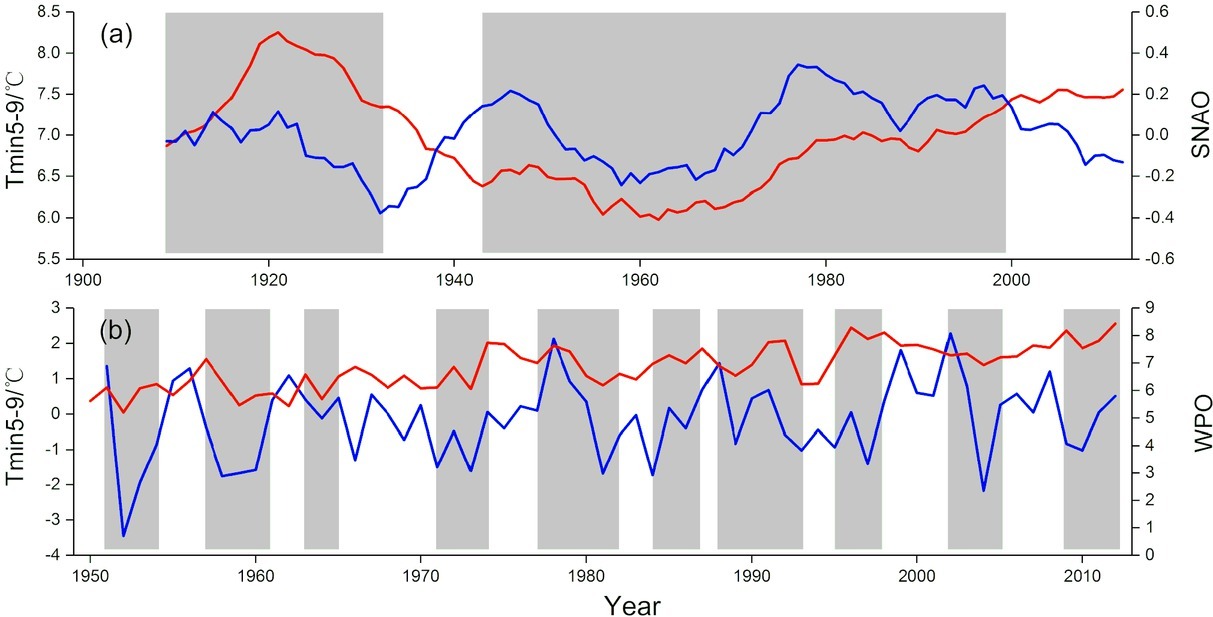
1950–2012), which indicates that the change in the sea temperature in the Western Pacific Ocean has an important influence on the temperature of the study area in the summer (Fig. 12b). Similar results have been found in other studies (Yu et al., 2013). Based on the above results, large-scale atmospheric–oceanic variability is also a major driving force for surface temperature changes in the study regions.
. Conclusions
The tree-ring chronology was developed by samples of Schrenk spruce collected from the National Nature Reserve of the Western Tianshan Mountains. The mean minimum temperature in the growing season is the main and stable limiting climate factor. Therefore, the mean minimum temperature series in the growing season during 1680–2012 was reconstructed based on the STD chronology. In the past 333 years, the mean minimum temperature has roughly experienced three relatively cold periods and relatively warm stages (relatively cold periods: 1680–1707, 1802–1911 and 1935–1997; relatively warm periods: 1708–1801, 1912–1934 and 1998–2012). By analyzing similar trends in regional temperature changes in our reconstruction series with drought events, large volcanic eruptions and other reconstruction series around the study regions in Xinjiang and even large-scale regions, we found that the mean minimum temperature of the reconstruction was accurate and reliant. Moreover, the mean minimum temperature was influenced by solar activity (sunspots) and large-scale atmospheric–oceanic fluctuations (NAO, WPO, ENSO, TBO) based on the MTM and spatial correlation analysis.