
. Introduction
Due to the environmental concerns associated with the use of fossil fuels, the member states of the European Union (EU) like other countries in the world are in the process of developing the use of alternative sources of energy including biomass, wave, and nuclear energies (Rajasekhar et al., 2015; Matsakas et al., 2017; Neha and Remya, 2022).
Among the sources of renewable energy, biomass used for biofuel production is obtained from forestry, microbial and agricultural systems (Kim et al., 2013). Biomass is an inexpensive and abundant source for biofuel production. Moreover, it has the potential for future sustainable development because it is characterised by zero net carbon dioxide (CO2) emissions and promotes employment in the rural area of a given country (Gutiérrez et al., 2018; Neha and Remya, 2022).
Liquid form of fuel (known as bio-oil) produced from biomass has several environmental advantages. Bio-oil is considered CO2 neutral and can produce the credits of CO2 without emitting sulphur oxides (SOX) (Fan et al., 2011). Furthermore, emissions of nitrogen oxides (NOX) by bio-oil are quantified 50% lower than those emitted by biodiesel in gas turbines (Boucher et al., 2000; Ikura et al., 2003; Gutiérrez et al., 2018). In addition to using bio-oil blends with heavy furnace oil to improve the quality of combustion, bio-oil is also used in diesel engines to replace fossil fuels and boilers and has several heating applications in furnaces (Soni and Karmee, 2020).
The use of biomass to produce biofuels including bio-oils that provide renewable and clean energy is one of the initiatives of the United Nations (UN) implemented for sustainable development goals (SDG) (Arun et al., 2021). It was implemented to valorise biomass waste regarding the reduction of environmental pollution (Cho et al., 2020). The development of renewable energy is one of the trivariate nexuses in the discourse of climate change and the agenda of sustainable development (Destek et al., 2021). Contrary, previous studies reported that though bio-oil enhances economic development depending on the methods used for their production, some bio-oils can contribute to environmental problems depending on the feedstock and the process of production by emitting more greenhouse gases (Jeswani et al., 2020; Destek et al., 2021). Due to that reason, several member states of the EU including Poland are developing systematic research on biofuels to understand their properties and deduce the consequences of biocomponent contents in the biofuels in different areas such as greenhouse gas emission, life cycles and toxicology (Hancsók et al., 2007; Do et al., 2014; Samson-Bręk et al., 2015).
To investigate the environmental changes that may be caused by the use of fuels in the member states of the EU, the isotope methods are being developed in several laboratories to determine the biocomponent contents in liquid fuels (Oinonen et al., 2010; Khundadze et al., 2022). In the Gliwice Radiocarbon and Mass Spectrometry Laboratory, a part of chronological purposes in geology and archaeology, the radiocarbon radioisotope (14C) method is being used to determine the content of biocarbon in both solid and liquid samples such as liquid fuels using the accelerator mass spectrometry (AMS) (Baranyika et al., 2022).
Because of old age, fossil fuels no longer contain the measurable 14C whereas the contemporary biosphere contains a lot of this radioisotope. As a result, the Member States of the EU are encouraged to produce energy from renewable resources such as biomass, and tax measures are applied to ensure that biofuel prices are comparable to those of fossil fuels (Dijs et al., 2006). According to Lee et al. (2022), the content of 14C may vary in biofuels depending on the geographic origin of biomass and the age type. Moreover, several factors including CO2 emissions from burning fossil fuels and the testing of nuclear weapons in the atmosphere may contribute to the variation of 14C concentration in the atmosphere.
AMS is an ultrasensitive technique to analyse the cosmogenic isotope including 14C, 26Al, 10Be and 36Cl (Tuniz et al., 2001; Lee et al., 2020). Prior to analysis, the investigated samples have to undergo preparation procedures to form a target suitable for a specific ion source. In AMS measurements process, all atoms and molecules extracted from the target are ionized followed by the dissociation of ionized molecules into the accelerator. Depending on energy, momentum and charge, the ionized atoms go through changes in charge state, and at the end of AMS procedure, the isotopes are counted individually to determine the isotopic ratios. Moreover, 14C is a significant AMS isotope in the studies of atmospheric processes, biomedicine, archaeology, and ocean circulation (Schuur et al., 2016; Lee et al., 2020).
This study aimed to determine the 14C content in bio-oils by means of a compact modern AMS system known as the Mini Carbon Dating System (MICADAS) in the Gliwice Radiocarbon and Mass Spectrometry Laboratory. The measurement results for the tested biofuels and the biomass used as the reference material were compared. Furthermore, this work will contribute to the accreditation of the tested method in the Gliwice Radiocarbon and Mass Spectrometry Laboratory.
. Materials and Methods
. Samples for Testing
In the present study, four samples were used: three samples of bio-oils from the catalytic process of biomass depolymerisation, and the biomass (pistachio shells) used for their production. The samples were provided by a manufacturer, and according to the information from the Safety Data Sheet the bio-oils are mixtures with the main constituent by weight of 30–90% of distillate-petroleum and hydrotreated heavy paraffinic oil. The other substances are 1H-Pyrrole (<10%) and 4-(2-Methoxyethyl)phenol (<10%), phenol (<8%), diisooctyl phthalate (<7%) and water (<5%).
. Preparation of Sample for AMS Measurement
The 14C measurement by AMS requires graphite targets (Wacker et al., 2010; Lee et al., 2020). As shown in Fig. 1, the process of graphitisation utilised to convert the original sample material into graphite is used in the Gliwice Radiocarbon and Mass Spectrometry for its fast, efficient, and convenient sample preparation for 14C measurement by means of AMS. In this study, 2 μL of each bio-oil sample was subsampled into the tin capsule for liquid samples (0.4 mL) using the micropipette (0.1–2 μL) and sealed with the sealing press. Further, each sub-sample was sealed in the second capsule for solid samples to prevent the loss of the sample due to evaporation. Besides, 6 mg of biomass (pistachio shell) used as a reference material was sub-sampled in tin capsule for solid samples. Then, 3 to 5 subsamples for each investigated samples were combusted in elemental analyser (EA) at 95 °C with Ca.66.67 mL (2.98 mmol) of oxygen dosing. Both glutamic and aspartic acids were used as standards to calibrate the EA instrument while 0.1% is the standard uncertainty of the instrument for carbon.
Fig 1.
Radiocarbon measurement process by AMS technique in the Gliwice Radiocarbon and Mass Spectrometry Laboratory. AMS, accelerator mass spectrometry.
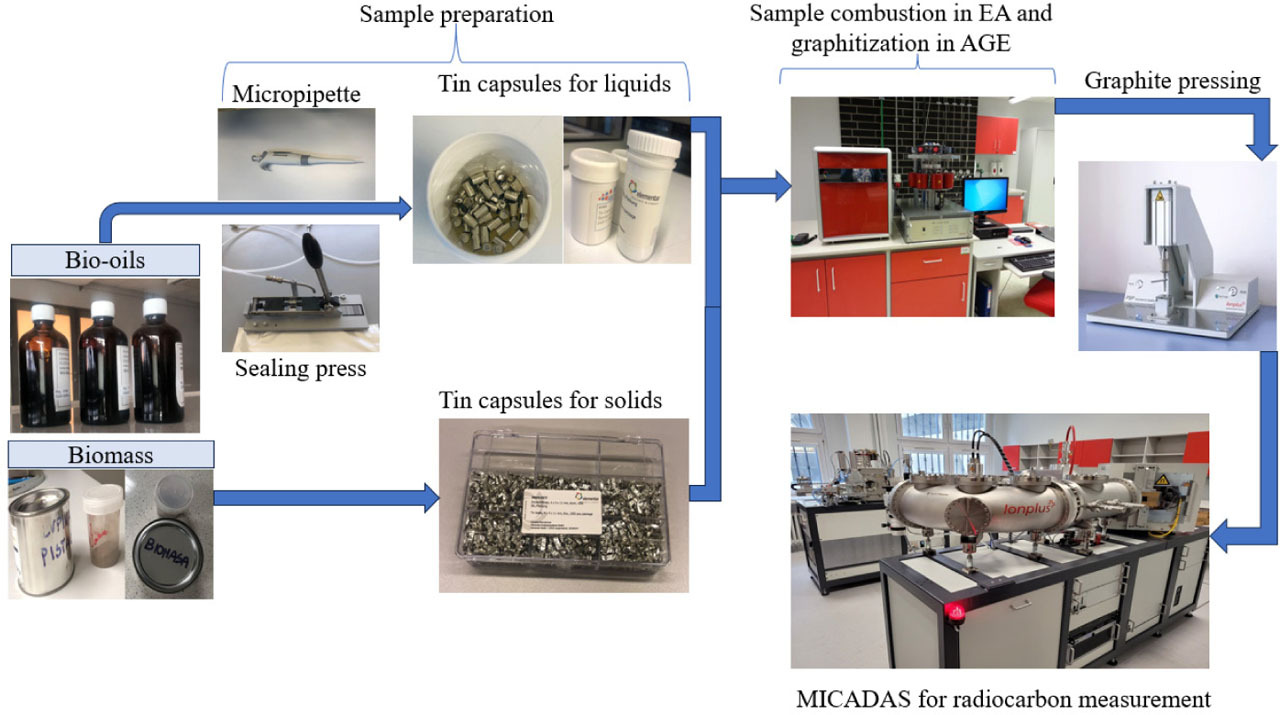
The produced CO2 from the combusted samples was graphitized by its reaction with hydrogen (H2) using iron powder as a catalyst. The obtained graphite targets consisting of 1 mg carbon and 5 mg iron were pressed using a pneumatic sample press (PSP) and measured by MICADAS accelerator to get radiocarbon content in the tested bio-oil fuels. Oxalic Acid II standard was used for normalisation, and the 14C-free petroleum prepared in the same way was used as a blank reference. The correction for isotope fractionation is based on simultaneous analysis of 13C and 12C in the AMS spectrometer. The standard uncertainty of the MICADAS is 0.3% for Oxalic Acid II.
Radiocarbon measurement results of all bio-oils and the reference material were reported in percent modern carbon (pMC) which is a percentage of 14C isotope concentration in the so-called modern biosphere. In addition, the calculations of biocarbon content were performed according to the EN 16640:2017 (E) using the following equation for biogenic carbon content relative to the reference value (xB):
where F14Csample is the radiocarbon content of a sample, and F14Cref is the radiocarbon content of a reference material.The biogenic carbon content in% by mass (xTCB) was calculated as follows:
where xTC is the total carbon content in the sample. The 14C content obtained for pistachio shells was used as a reference value (F14Cref).. Results and Discussions
The content of carbon in percentage (% C) by mass was the foremost parameter of concern in this study. According to the results reported in Table 2, the calculated average of %C content was 79.7 ± 1.7%, 68.7 ± 2.1%, 47.0 ± 1.1%, and 48.82 ± 0.3% for bio-oil-1, bio-oil-2, bio-oil-3, and the pistachio shell, respectively. Based on the obtained carbon content results from each sample, 2 μL of each bio-oil sample and 6 mg of pistachio shell were sufficient to get at least 1 mg of carbon to produce graphite targets for measuring 14C by means of MICADAS accelerator. Furthermore, as shown in Table 1, several measurements of 14C content were conducted on different days and in different batches to test the reproducibility of each sample used for investigation.
Table 1.
Reproducibility test for radiocarbon measurements in bio-oil fuels.
| Sample name | Laboratory code | Number of experiment | 14C concentration (pMC) | Average 14C concentration (pMC) | χ2 test for α = 0.05 CV = 5.99 |
|---|---|---|---|---|---|
| Bio-oil-1 | GdA-6968.1.5 | Experiment-1 | 27.72 ± 0.59 | 28.14 ± 0.36 | χ2 = 1.21 |
| GdA-6968.1.3 | Experiment-2 | 28.31 ± 0.18 | Significant | ||
| GdA-6968.1.4 | Experiment-3 | 28.40 ± 0.19 | |||
| GdA-6968.1.2 | Experiment-4 | 29.46 ± 0.56* | |||
| Bio-oil-2 | GdA-6969.1.1 | Experiment-1 | 74.71 ± 0.32 | 74.95 ± 0.22 | χ2 = 1.08 |
| GdA-6969.1.2 | Experiment-2 | 74.95 ± 0.32 | Significant | ||
| GdA-6969.1.3 | Experiment-3 | 75.18 ± 0.32 | |||
| GdA-6969.1.5 | Experiment-4 | 76.07 ± 0.32* | |||
| GdA-6969.1.4 | Experiment-5 | 73.29 ± 0.32* | |||
| Bio-oil-3 | GdA-6970.1.1 | Experiment-1 | 113.00 ± 0.28 | 112.92 ± 0.07 | χ2 = 0.15 |
| GdA-6970.1.2 | Experiment-2 | 112.85 ± 0.28 | Significant | ||
| GdA-6970.1.5 | Experiment-3 | 112.91 ± 0.28 | |||
| GdA-6970.1.3 | Experiment-4 | 110.85 ± 0.40* | |||
| GdA-6970.1.4 | Experiment-5 | 110.11 ± 0.41* | |||
| Pistachio shell (reference material) | GdA-6971.1.1 | Experiment-1 | 102.58 ± 0.29 | 102.61 ± 0.21 | χ2 = 0.41 |
| GdA-6971.1.2 | Experiment-2 | 102.82 ± 0.29 | Significant | ||
| GdA-6971.1.3 | Experiment-3 | 102.61 ± 0.29 |
As can be seen in Table 1, each fuel sample was measured 4 to 5 times to confirm the effect of the sample homogeneity on the final measurement results. The unreproducible 14C measurement results indicated some inhomogeneity in the sample material. Therefore, the outlying results were discarded and were not used to calculate the average values. The recorded average values of 14C measurement results for homogeneous sub-samples were 28.14 ± 0.4 pMC, 74.95 ± 0.22 pMC, 112.92 ± 0.07 pMC and 102.61 ± 0.21 pMC, respectively for bio-oil-1, bio-oil-2, bio-oil-3 and the pistachio shell, which is used as the reference material.
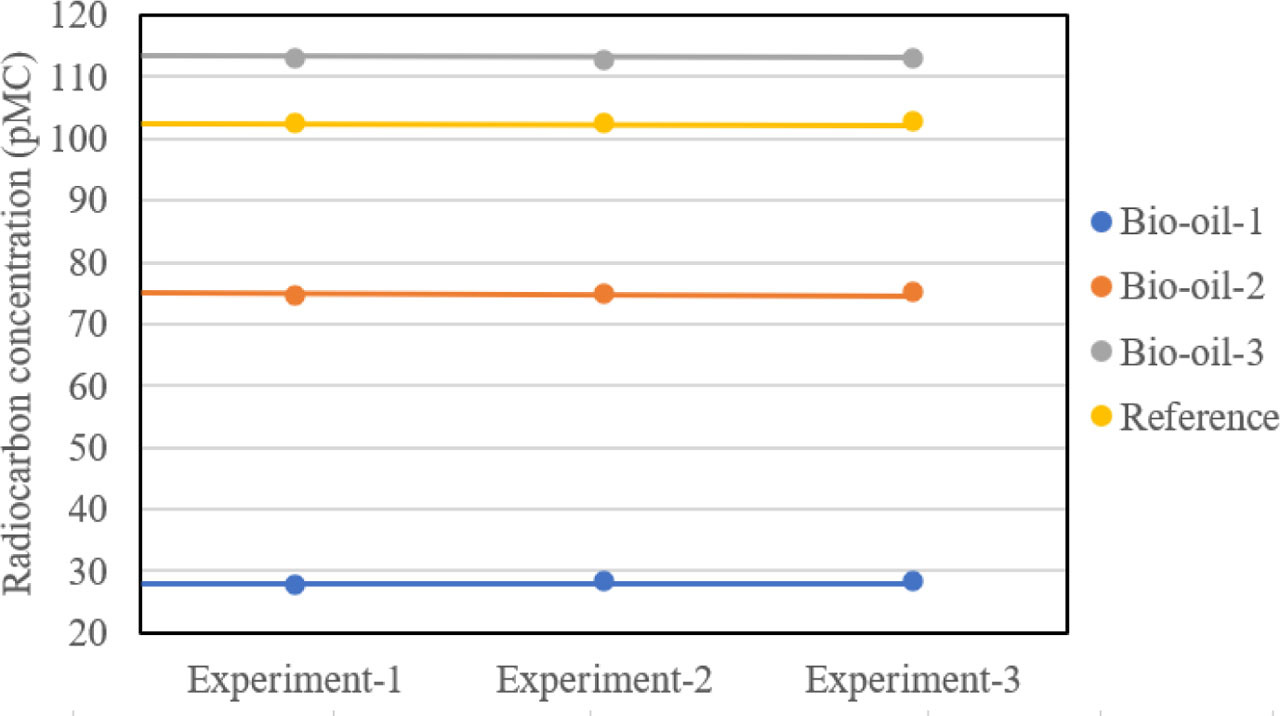
However, the main objective of this study was not only in getting the radiocarbon values, but in testing the reproducibility of the sample preparation procedure in the Gliwice radiocarbon laboratory. Figure 2 graphically explains the reproducibility of the radiocarbon measurement results for all bio-oil samples and the reference material. To confirm the reproducibility of the measurement results, a chi-square (χ2) test was carried out as well. As shown in Table 1, the calculated χ2 values were 1.21, 1.08, 0.15 and 0.41, respectively for bio-oil-1, bio-oil-2, bio-oil-3, and the pistachio shell. The calculated critical value (CV) for 3 measurements was 5.99 (at a confidence level α = 0.05). Therefore, all χ2 values were less than CV, which confirmed a non-significant difference, and this showed that the procedure for sample preparation and the radiocarbon measurement using MICADAS produced reliable results.
Fig 2.
Graphical presentation of reproducibility test for radiocarbon measurement in bio-oils by AMS; 2-sigma error bars are invisible at this scale. AMS, accelerator mass spectrometry.
The biogenic carbon content values were determined based on 14C concentration. The results in Table 2 showed that the determined biogenic carbon content relative to the measured 14C of pistachio shell as reference material (102.61 ± 0.29 pMC) value were 27.43 ± 0.42, 73.04 ± 0.30 and 110.04 ± 0.22 for bio-oil-1, bio-oil-2, and bio-oil-3, respectively. The biogenic carbon content in percent (%) by mass was 21.87 ± 1.76%, 50.16 ± 2.09% and 51.73 ± 1.10%, respectively for bio-oil-1, bio-oil-2, and bio-oil-3. For the reference material, the yielded biogenic carbon content in percent (%) by mass was 48.82 ± 0.39%.
Table 2.
Calculated radiocarbon, carbon and biocarbon contents in bio-oil samples.
Surprisingly, the results showed a higher 14C value of bio-oil-3 (111.94 ± 0.31 pMC) compared to biomass used as reference material (102.61 ± 0.21 pMC). The calculated biogenic carbon content relative to the reference value was also higher for bio-oil-3 (110.04 ± 0.22) compared to the reference sample (100.00 ± 0.29). Additionally, as shown in Fig. 3, the results in Fig. 3A showed that the bio-oil-3 was most likely developed in AD 1993–1994 while the results in Fig. 3B showed that the reference material was developed in AD 2012–2016.
Fig 3.
Calibration of F14C results for bio-oil sample-3 (A) and the pistachio shell reference sample (B) and Ox Cal v.4.4 (Bronk Ramsey, 2009) using the post-bomb atmospheric NH1 curve (Reimer et al., 2004; Hua et al., 2022). The F14C values are used commonly in the calibration process, and the relation to pMC is pMC = F14C*100 (Stenström et al., 2011). pMC, percent modern carbon.
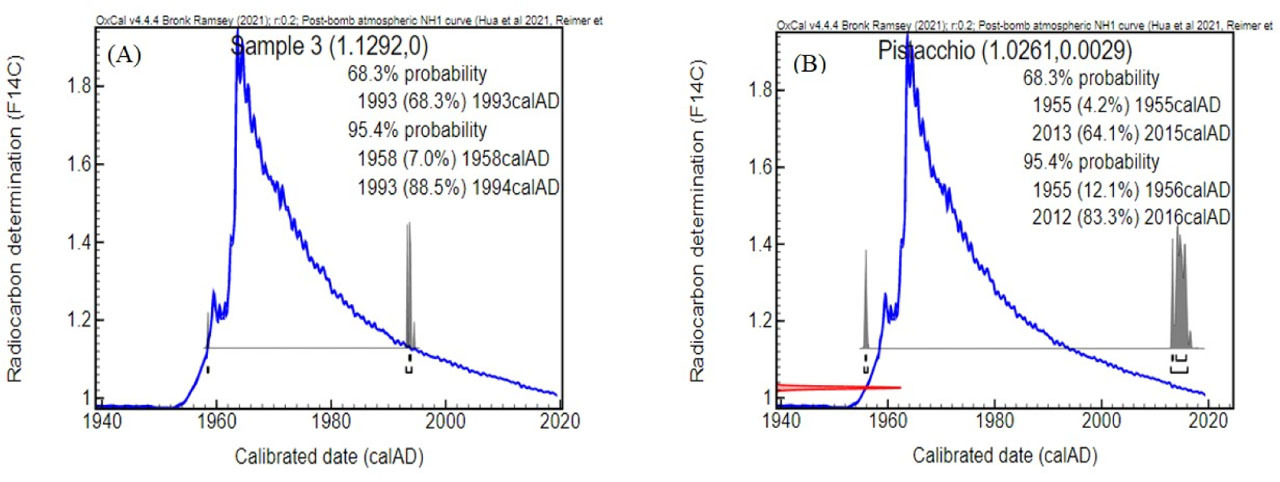
This phenomenon indicated that only two samples including bio-oil-1 and bio-oil-2 were produced by mixing distillate with the investigated pistachio shell while bio-oil-3 was produced from another unknown biomass whose details were not provided by the sample provider. This conclusion was confirmed by the company that provided the samples, but further information was confidential.
. Conclusions
Each aliquot of the original bio-oil sample should always be representative for getting accurate and reproducible results, but in reality, it needs to be tested by running multiple measurements. The findings of the study showed reliable results for the reproducibility test of homogenous bio-oil samples, which proved the precision of the AMS technique by MICADAS for 14C measurement in the Gliwice Radiocarbon and Mass Spectrometry Laboratory. The results for radiocarbon content showed that the submitted reference material (Pistachio) was not used to produce the bio-oil-3. Furthermore, the biogenic carbon content was determined based on 14C content because only carbon was taken into consideration, and no other biogenic elements, such as oxygen and hydrogen, were not considered. Moreover, due to the high increase in demand for biofuels for energy production in this rapidly developing world, many systematic studies on biofuels need to be done to deduce the consequences of biocomponents in different areas such as greenhouse gas emissions, toxicology, and life cycle. Eventually, in the future, additional tests will be conducted using different samples to confirm the precision of the AMS technique in the Gliwice Radiocarbon Laboratory.